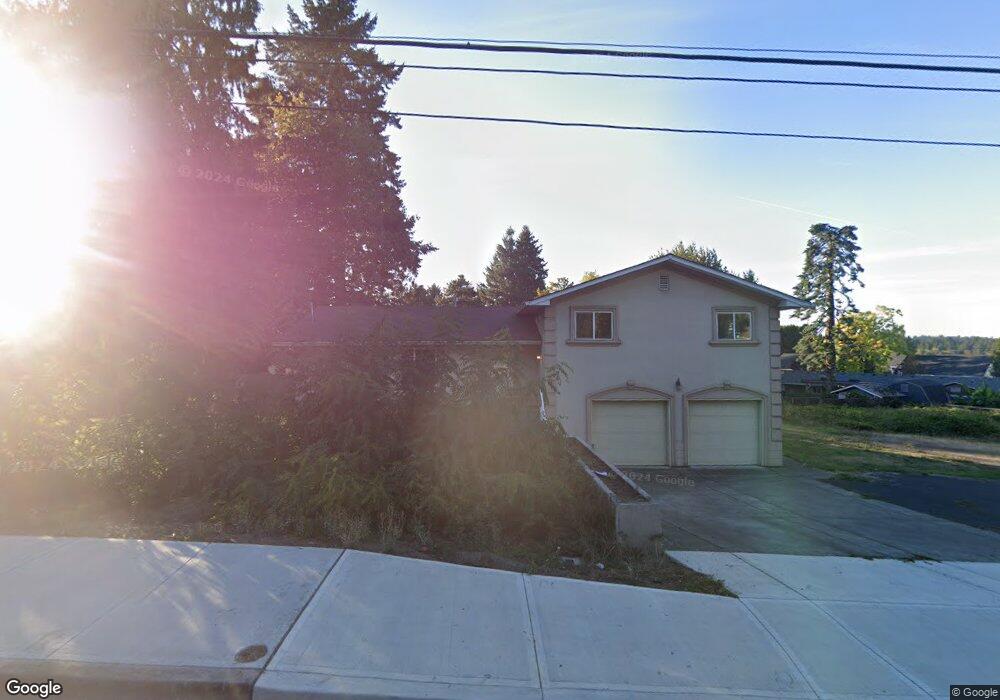
20105 SW Boones Ferry Rd Tualatin, OR 97062
Estimated Value: $543,000 - $718,000
3
Beds
2
Baths
1,420
Sq Ft
$429/Sq Ft
Est. Value
About This Home
This home is located at 20105 SW Boones Ferry Rd, Tualatin, OR 97062 and is currently estimated at $609,180, approximately $429 per square foot. 20105 SW Boones Ferry Rd is a home located in Washington County with nearby schools including Tualatin Elementary School, Hazelbrook Middle School, and Tualatin High School.
Ownership History
Date
Name
Owned For
Owner Type
Purchase Details
Closed on
Dec 10, 1998
Sold by
First National Bank Of Chicago
Bought by
Chernobersky Naum and Chernobersky Deena
Current Estimated Value
Purchase Details
Closed on
Mar 16, 1998
Sold by
Sybil Robert and Sybil Earlene
Bought by
The First National Bank Of Chicago
Purchase Details
Closed on
Dec 6, 1995
Sold by
Barlow Ervin C and Barlow Karen K
Bought by
Sybil Robert and Sybil Earlene
Home Financials for this Owner
Home Financials are based on the most recent Mortgage that was taken out on this home.
Original Mortgage
$120,750
Interest Rate
10.62%
Purchase Details
Closed on
Nov 1, 1994
Sold by
Barlow Ervin and Barlow Karen
Bought by
Sybil Robert C and Sybil Earlene M
Home Financials for this Owner
Home Financials are based on the most recent Mortgage that was taken out on this home.
Original Mortgage
$64,365
Interest Rate
7.1%
Create a Home Valuation Report for This Property
The Home Valuation Report is an in-depth analysis detailing your home's value as well as a comparison with similar homes in the area
Home Values in the Area
Average Home Value in this Area
Purchase History
| Date | Buyer | Sale Price | Title Company |
|---|---|---|---|
| Chernobersky Naum | $140,750 | Pacific Nw Title | |
| The First National Bank Of Chicago | $134,211 | Transnation Title Insurance | |
| Sybil Robert | $100,000 | Ticor Title | |
| Sybil Robert C | $100,000 | Ticor Title |
Source: Public Records
Mortgage History
| Date | Status | Borrower | Loan Amount |
|---|---|---|---|
| Previous Owner | Sybil Robert | $120,750 | |
| Previous Owner | Sybil Robert C | $64,365 |
Source: Public Records
Tax History Compared to Growth
Tax History
| Year | Tax Paid | Tax Assessment Tax Assessment Total Assessment is a certain percentage of the fair market value that is determined by local assessors to be the total taxable value of land and additions on the property. | Land | Improvement |
|---|---|---|---|---|
| 2026 | $4,481 | $271,370 | -- | -- |
| 2025 | $4,481 | $263,470 | -- | -- |
| 2024 | $4,364 | $255,800 | -- | -- |
| 2023 | $4,364 | $248,350 | $0 | $0 |
| 2022 | $4,175 | $248,350 | $0 | $0 |
| 2021 | $4,073 | $234,100 | $0 | $0 |
| 2020 | $3,952 | $227,290 | $0 | $0 |
| 2019 | $3,846 | $220,670 | $0 | $0 |
| 2018 | $3,690 | $214,250 | $0 | $0 |
| 2017 | $3,474 | $208,010 | $0 | $0 |
| 2016 | $3,313 | $201,960 | $0 | $0 |
| 2015 | $3,179 | $196,080 | $0 | $0 |
| 2014 | $3,088 | $190,370 | $0 | $0 |
Source: Public Records
Map
Nearby Homes
- 20305 SW 86th Ave
- 8524 SW Mohawk St Unit 8524
- 8512 SW Mohawk St Unit 8512
- 20168 SW Tillamook Ct
- 20182 SW Tillamook Ct
- 20025 SW 94th Place
- 8370 SW Seminole Trail
- 20685 SW Siletz Ct
- 8196 SW Shenandoah Way Unit 8196
- 8501 SW Iroquois Dr
- 9495 SW Cherry Ln
- 8200 SW Piute Ct
- 20900 SW Winema Dr
- 8475 SW Tualatin Rd
- 21565 SW Alsea Ct
- 20515 SW 104th Ave
- 8720 SW Tualatin Rd Unit 315
- 8720 SW Tualatin Rd Unit 201
- 7191 SW Sagert St Unit 103
- 20752 SW 104th Ave
- 8910 SW Sagert St
- 20085 SW Boones Ferry Rd
- 20155 SW Boones Ferry Rd
- 8900 SW Sagert St
- 8920 SW Sagert St
- 8850 SW Sagert St
- 20160 SW Boones Ferry Rd
- 20130 SW Boones Ferry Rd
- 20100 SW Boones Ferry Rd
- 8940 SW Sagert St
- 8970 SW Sagert St
- 20190 SW Boones Ferry Rd
- 20195 SW Boones Ferry (Ta: R0537066) Rd
- 20195 SW Boones Ferry Rd
- 8800 SW Sagert St
- 9240 SW Cree Cir
- 9040 SW Sagert St
- 9236 SW Cree Cir
- 9030 SW Sagert St
- 20245 SW Comanche Terrace