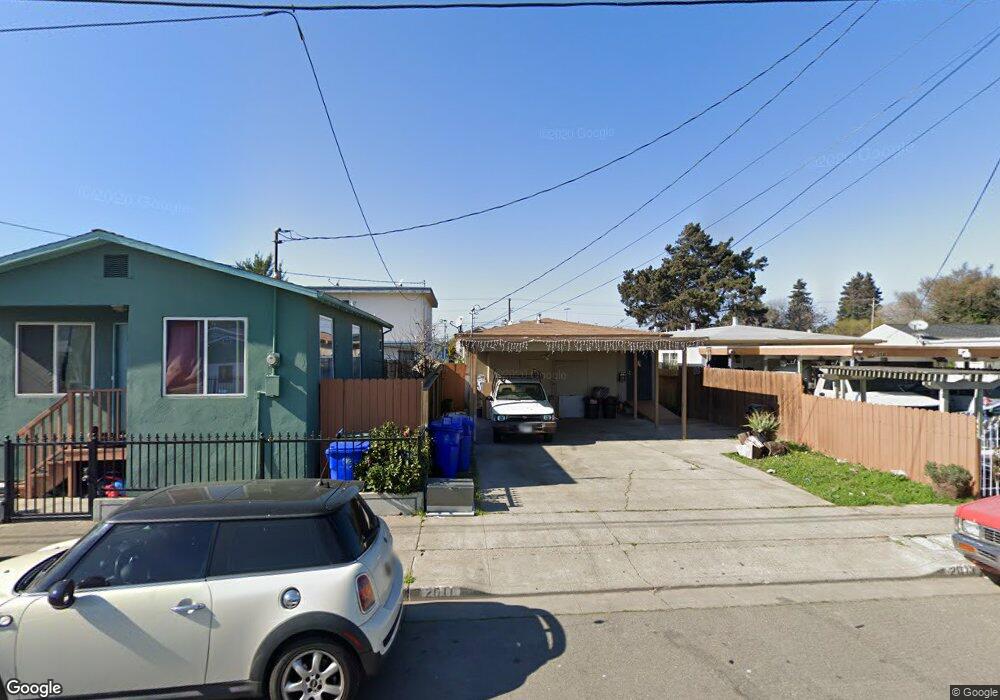
2011 22nd St Unit 2013 San Pablo, CA 94806
Estimated Value: $504,000 - $765,000
Studio
2
Baths
1,200
Sq Ft
$512/Sq Ft
Est. Value
About This Home
This home is located at 2011 22nd St Unit 2013, San Pablo, CA 94806 and is currently estimated at $614,654, approximately $512 per square foot. 2011 22nd St Unit 2013 is a home located in Contra Costa County with nearby schools including Dover Elementary School, Walter T. Helms Middle School, and Richmond High School.
Ownership History
Date
Name
Owned For
Owner Type
Purchase Details
Closed on
Sep 18, 2022
Sold by
Griselda Ledesma
Bought by
Chelas Trust
Current Estimated Value
Purchase Details
Closed on
Jan 14, 2020
Sold by
Ledesma Griselda and Ledesma Leticia
Bought by
Ledesma Griselda and Ledesma Leticia
Home Financials for this Owner
Home Financials are based on the most recent Mortgage that was taken out on this home.
Original Mortgage
$346,500
Interest Rate
3.6%
Mortgage Type
New Conventional
Purchase Details
Closed on
Aug 15, 2016
Sold by
Ledesma Griselda and Mendoza Leticia
Bought by
Ledesma Griselda and Mendoza Leticia
Home Financials for this Owner
Home Financials are based on the most recent Mortgage that was taken out on this home.
Original Mortgage
$255,000
Interest Rate
3.41%
Mortgage Type
New Conventional
Purchase Details
Closed on
Sep 14, 2015
Sold by
Ledesma Griselda
Bought by
Ledesma Griselda and Mendoza Leticia
Purchase Details
Closed on
Aug 19, 2004
Sold by
Ledesma Griselda M
Bought by
Ledesma Griselda
Create a Home Valuation Report for This Property
The Home Valuation Report is an in-depth analysis detailing your home's value as well as a comparison with similar homes in the area
Home Values in the Area
Average Home Value in this Area
Purchase History
| Date | Buyer | Sale Price | Title Company |
|---|---|---|---|
| Chelas Trust | -- | -- | |
| Ledesma Griselda | -- | First American Title Company | |
| Ledesma Griselda | -- | Old Republic Title Company | |
| Ledesma Griselda | $78,000 | None Available | |
| Ledesma Griselda | -- | -- |
Source: Public Records
Mortgage History
| Date | Status | Borrower | Loan Amount |
|---|---|---|---|
| Previous Owner | Ledesma Griselda | $346,500 | |
| Previous Owner | Ledesma Griselda | $255,000 |
Source: Public Records
Tax History
| Year | Tax Paid | Tax Assessment Tax Assessment Total Assessment is a certain percentage of the fair market value that is determined by local assessors to be the total taxable value of land and additions on the property. | Land | Improvement |
|---|---|---|---|---|
| 2025 | $5,179 | $241,434 | $134,667 | $106,767 |
| 2024 | $4,917 | $236,701 | $132,027 | $104,674 |
| 2023 | $4,917 | $232,061 | $129,439 | $102,622 |
| 2022 | $4,819 | $227,511 | $126,901 | $100,610 |
| 2021 | $4,758 | $223,051 | $124,413 | $98,638 |
| 2019 | $4,519 | $216,437 | $120,724 | $95,713 |
| 2018 | $4,314 | $212,194 | $118,357 | $93,837 |
| 2017 | $4,169 | $208,035 | $116,037 | $91,998 |
| 2016 | $4,063 | $203,957 | $113,762 | $90,195 |
| 2015 | $3,401 | $155,544 | $76,360 | $79,184 |
| 2014 | $3,401 | $152,498 | $74,865 | $77,633 |
Source: Public Records
Map
Nearby Homes
- 1971 23rd St
- 2036 Brookside Dr
- 1945 21st St
- 2011 Market Ave Unit 317
- 1780 Road 20
- 110 Del Alba St
- 1800 Post Ave
- 112 Serra Way Unit 19
- 2376 Bush Ave
- 213 Carmel St Unit 50
- 2420 Bush Ave
- 2802 Chattleton Ln
- 2814 Chattleton Ln
- 2818 Chattleton Ln
- 117 Carmel St
- 101 San Gabriel Ct
- 2801 Asher Ct
- 2606 Bush Ave
- 2805 Asher Ct
- 1413 Post Ave
- 2017 22nd St Unit 2019
- 2009 22nd St
- 2005 22nd St
- 2016 22nd St Unit 2016
- 2031 22nd St
- 2001 22nd St
- 2012 21st St
- 2006 21st St
- 2016 21st St
- 2000 21st St
- 1999 22nd St
- 2033 22nd St
- 1998 21st St
- 2014 22nd St Unit 2014 22nd st
- 2014 22nd St Unit 2018
- 2002 22nd St
- 2040 21st St
- 2022 22nd St
- 2000 22nd St
- 1995 22nd St
Your Personal Tour Guide
Ask me questions while you tour the home.