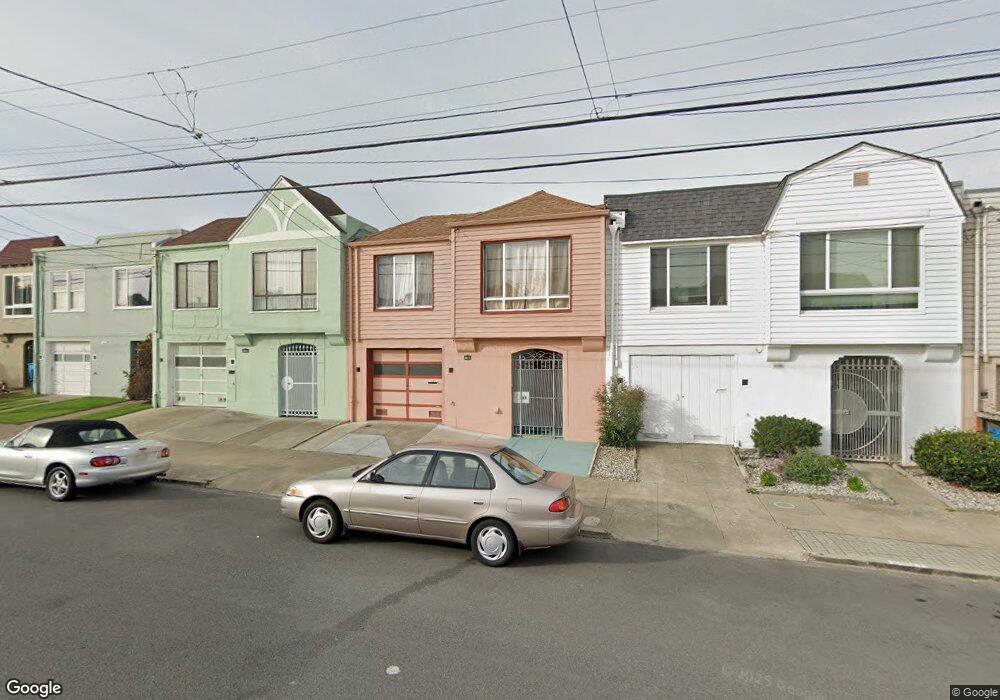
2011 44th Ave San Francisco, CA 94116
Outer Parkside NeighborhoodEstimated Value: $1,425,000 - $1,706,000
2
Beds
1
Bath
1,214
Sq Ft
$1,276/Sq Ft
Est. Value
About This Home
This home is located at 2011 44th Ave, San Francisco, CA 94116 and is currently estimated at $1,549,095, approximately $1,276 per square foot. 2011 44th Ave is a home located in San Francisco County with nearby schools including Sunset Elementary School, Giannini (A.P.) Middle School, and Holy Name Elementary School.
Ownership History
Date
Name
Owned For
Owner Type
Purchase Details
Closed on
May 15, 2025
Sold by
Tse King Tong and Aiyi Yu
Bought by
Aiyi Yu Tse And King Tong Tse Revocable Trust and Tse
Current Estimated Value
Purchase Details
Closed on
Jun 26, 2009
Sold by
Delucchi Serine H
Bought by
Tse King Tong and Tse Anyi
Home Financials for this Owner
Home Financials are based on the most recent Mortgage that was taken out on this home.
Original Mortgage
$375,000
Interest Rate
4.79%
Mortgage Type
Purchase Money Mortgage
Purchase Details
Closed on
Feb 28, 1994
Sold by
Souther Jack Neal
Bought by
Souther Jack Neal
Create a Home Valuation Report for This Property
The Home Valuation Report is an in-depth analysis detailing your home's value as well as a comparison with similar homes in the area
Home Values in the Area
Average Home Value in this Area
Purchase History
| Date | Buyer | Sale Price | Title Company |
|---|---|---|---|
| Aiyi Yu Tse And King Tong Tse Revocable Trust | -- | None Listed On Document | |
| Tse King Tong | $625,000 | Chicago Title Company | |
| Souther Jack Neal | -- | -- |
Source: Public Records
Mortgage History
| Date | Status | Borrower | Loan Amount |
|---|---|---|---|
| Previous Owner | Tse King Tong | $375,000 |
Source: Public Records
Tax History
| Year | Tax Paid | Tax Assessment Tax Assessment Total Assessment is a certain percentage of the fair market value that is determined by local assessors to be the total taxable value of land and additions on the property. | Land | Improvement |
|---|---|---|---|---|
| 2025 | $9,998 | $868,050 | $564,730 | $303,320 |
| 2024 | $9,998 | $851,031 | $553,657 | $297,374 |
| 2023 | $9,855 | $834,346 | $542,801 | $291,545 |
| 2022 | $10,300 | $817,987 | $532,158 | $285,829 |
| 2021 | $10,114 | $801,951 | $521,724 | $280,227 |
| 2020 | $10,169 | $793,730 | $516,375 | $277,355 |
| 2019 | $9,821 | $778,168 | $506,250 | $271,918 |
| 2018 | $9,490 | $762,911 | $496,324 | $266,587 |
| 2017 | $9,078 | $747,955 | $486,593 | $261,362 |
| 2016 | $8,916 | $733,291 | $477,052 | $256,239 |
| 2015 | $8,538 | $722,278 | $469,887 | $252,391 |
| 2014 | $8,312 | $708,132 | $460,683 | $247,449 |
Source: Public Records
Map
Nearby Homes
Your Personal Tour Guide
Ask me questions while you tour the home.