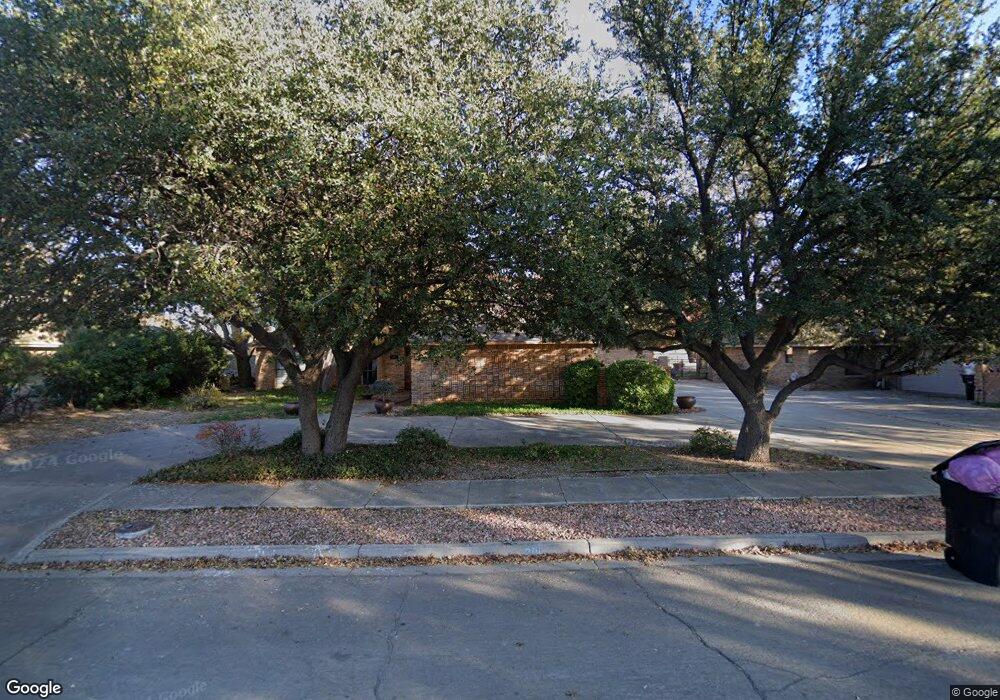
2011 Brazos St Roswell, NM 88201
Estimated Value: $146,000 - $448,000
3
Beds
2
Baths
2,314
Sq Ft
$145/Sq Ft
Est. Value
About This Home
This home is located at 2011 Brazos St, Roswell, NM 88201 and is currently estimated at $336,379, approximately $145 per square foot. 2011 Brazos St is a home located in Chaves County with nearby schools including Military Heights Elementary School, Berrendo Middle School, and Goddard High School.
Ownership History
Date
Name
Owned For
Owner Type
Purchase Details
Closed on
Jan 24, 2008
Sold by
Vance Deborah K and Monk Deborah K
Bought by
Antenucci Cristina and Antenucci Mark D
Current Estimated Value
Home Financials for this Owner
Home Financials are based on the most recent Mortgage that was taken out on this home.
Original Mortgage
$241,000
Outstanding Balance
$151,727
Interest Rate
6.11%
Mortgage Type
Credit Line Revolving
Estimated Equity
$184,652
Purchase Details
Closed on
Apr 19, 2005
Sold by
Yarger Richard J and Yarger Barbara A
Bought by
Antenucci Mark A and Antenucci Cristina
Home Financials for this Owner
Home Financials are based on the most recent Mortgage that was taken out on this home.
Original Mortgage
$220,000
Interest Rate
5.89%
Mortgage Type
New Conventional
Purchase Details
Closed on
Oct 22, 2004
Sold by
Bodo Carroll S
Bought by
Yarger Richard J and Yarger Barbara A
Create a Home Valuation Report for This Property
The Home Valuation Report is an in-depth analysis detailing your home's value as well as a comparison with similar homes in the area
Home Values in the Area
Average Home Value in this Area
Purchase History
| Date | Buyer | Sale Price | Title Company |
|---|---|---|---|
| Antenucci Cristina | -- | Landamerica Lawyers Title Of | |
| Antenucci Mark A | -- | None Available | |
| Yarger Richard J | -- | None Available |
Source: Public Records
Mortgage History
| Date | Status | Borrower | Loan Amount |
|---|---|---|---|
| Open | Antenucci Cristina | $241,000 | |
| Previous Owner | Antenucci Mark A | $220,000 |
Source: Public Records
Tax History Compared to Growth
Tax History
| Year | Tax Paid | Tax Assessment Tax Assessment Total Assessment is a certain percentage of the fair market value that is determined by local assessors to be the total taxable value of land and additions on the property. | Land | Improvement |
|---|---|---|---|---|
| 2025 | $2,818 | $106,746 | $10,333 | $96,413 |
| 2024 | $2,818 | $103,637 | $10,333 | $93,304 |
| 2023 | $2,825 | $100,618 | $10,333 | $90,285 |
| 2022 | $2,779 | $99,948 | $10,333 | $89,615 |
| 2021 | $2,758 | $97,037 | $10,333 | $86,704 |
| 2020 | $2,699 | $94,948 | $10,333 | $84,615 |
| 2019 | $2,724 | $95,993 | $10,333 | $85,660 |
| 2018 | $2,677 | $94,468 | $10,667 | $83,801 |
| 2017 | $2,635 | $93,849 | $10,667 | $83,182 |
| 2016 | $2,647 | $95,217 | $10,667 | $84,550 |
| 2015 | $2,889 | $94,463 | $10,667 | $83,796 |
| 2014 | $5,643 | $92,262 | $10,667 | $81,595 |
Source: Public Records
Map
Nearby Homes
- 2009 Brazos St
- 5 Jack McClellan Dr
- 8 Jack McClellan Dr
- 17 Jack McClellan Dr
- 16 Jack McClellan Dr
- 1822 N Kansas Ave
- 12228 Bella Vita Dr
- 18 Jack McClellan Dr
- 3000 BLK N Kentucky Ave
- 1224 Bella Vita Dr
- 700 Chrysler Dr
- 21 Jack McClellan Dr
- 2601 Sherrill Ln
- 0000 BLK N Washington Ave
- 2603 Sherrill Ln
- 2605 Sherrill Ln
- 1727 N Delaware Ave
- 317 Sherrill Unit 5 Ln
- 317 Sherrill Lane #25 Ln
- 317 Sherrill Ln #14 Ln
- 2013 Brazos St
- 2010 Brazos St
- 2012 Brazos St
- 2015 Brazos St
- 2008 Brazos St
- 4 Brazos Ct
- 2016 Brazos St
- 3 Brazos Ct
- 2003 Brazos St
- 1 Brazos Ct
- 2 Brazos Ct
- 2001 Brazos St
- 2203 N Washington Ave
- 2205 N Washington Ave
- 2201 N Washington Ave
- 703 Brazos St
- 2111 N Washington Ave
- 2207 N Washington Ave
- 2109 N Washington Ave