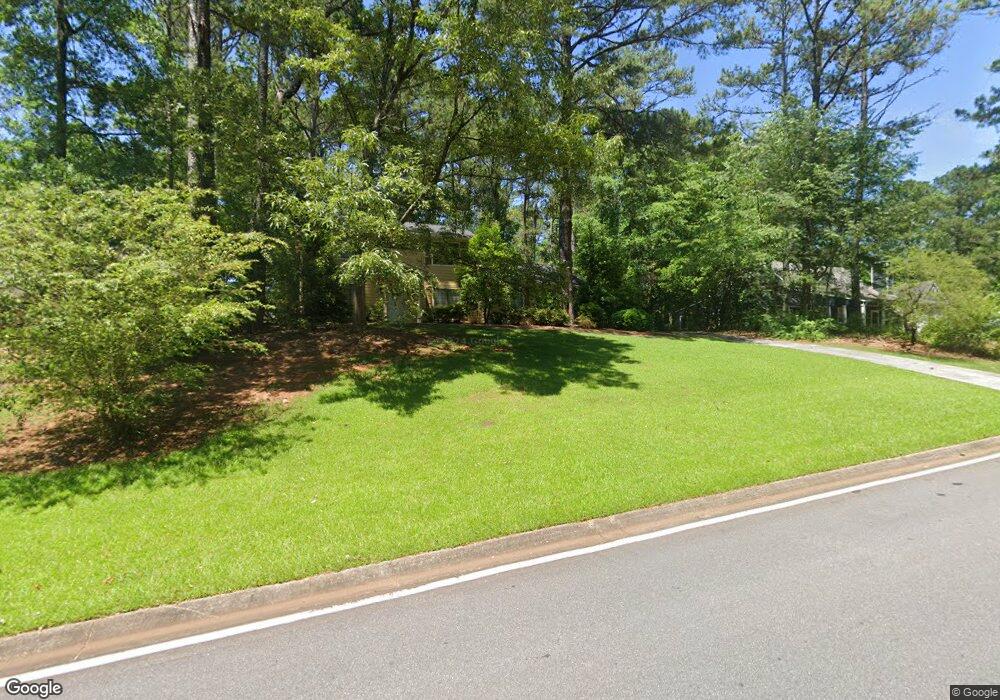
2011 Kemp Rd NE Marietta, GA 30066
Sandy Plains NeighborhoodEstimated Value: $368,000 - $392,000
3
Beds
5
Baths
1,672
Sq Ft
$230/Sq Ft
Est. Value
About This Home
This home is located at 2011 Kemp Rd NE, Marietta, GA 30066 and is currently estimated at $384,460, approximately $229 per square foot. 2011 Kemp Rd NE is a home located in Cobb County with nearby schools including Keheley Elementary School, McCleskey Middle School, and The Garden School.
Ownership History
Date
Name
Owned For
Owner Type
Purchase Details
Closed on
Apr 19, 2021
Sold by
Corbin Sheila G
Bought by
Klpg Investments Llc
Current Estimated Value
Purchase Details
Closed on
Mar 29, 2018
Sold by
Gembinski William G
Bought by
Corbin Sheila G
Home Financials for this Owner
Home Financials are based on the most recent Mortgage that was taken out on this home.
Original Mortgage
$183,175
Interest Rate
4.43%
Mortgage Type
New Conventional
Purchase Details
Closed on
Apr 3, 2000
Sold by
Thomas Thomas F
Bought by
Gembinski William G and Gembinski Lisa C
Home Financials for this Owner
Home Financials are based on the most recent Mortgage that was taken out on this home.
Original Mortgage
$108,000
Interest Rate
8.34%
Mortgage Type
New Conventional
Purchase Details
Closed on
Apr 24, 1997
Sold by
Houmes David L and Houmes Rose H
Bought by
Thomas Thomas F
Home Financials for this Owner
Home Financials are based on the most recent Mortgage that was taken out on this home.
Original Mortgage
$115,798
Interest Rate
7.85%
Mortgage Type
FHA
Create a Home Valuation Report for This Property
The Home Valuation Report is an in-depth analysis detailing your home's value as well as a comparison with similar homes in the area
Home Values in the Area
Average Home Value in this Area
Purchase History
| Date | Buyer | Sale Price | Title Company |
|---|---|---|---|
| Klpg Investments Llc | $235,000 | None Available | |
| Corbin Sheila G | $215,500 | -- | |
| Gembinski William G | $135,000 | -- | |
| Thomas Thomas F | $117,000 | -- |
Source: Public Records
Mortgage History
| Date | Status | Borrower | Loan Amount |
|---|---|---|---|
| Previous Owner | Corbin Sheila G | $183,175 | |
| Previous Owner | Gembinski William G | $108,000 | |
| Previous Owner | Thomas Thomas F | $115,798 |
Source: Public Records
Tax History Compared to Growth
Tax History
| Year | Tax Paid | Tax Assessment Tax Assessment Total Assessment is a certain percentage of the fair market value that is determined by local assessors to be the total taxable value of land and additions on the property. | Land | Improvement |
|---|---|---|---|---|
| 2025 | $4,264 | $141,516 | $36,000 | $105,516 |
| 2024 | $4,267 | $141,516 | $36,000 | $105,516 |
| 2023 | $4,267 | $141,516 | $36,000 | $105,516 |
| 2022 | $2,853 | $94,000 | $20,760 | $73,240 |
| 2021 | $838 | $89,084 | $24,000 | $65,084 |
| 2020 | $838 | $89,084 | $24,000 | $65,084 |
| 2019 | $2,356 | $77,628 | $18,400 | $59,228 |
| 2018 | $1,807 | $76,604 | $18,400 | $58,204 |
| 2017 | $1,664 | $72,692 | $18,400 | $54,292 |
| 2016 | $1,311 | $56,528 | $17,200 | $39,328 |
| 2015 | $1,378 | $58,120 | $12,000 | $46,120 |
| 2014 | $1,388 | $58,120 | $0 | $0 |
Source: Public Records
Map
Nearby Homes
- 4509 N Bay Ct
- 4509 N Landing Dr
- 1765 Blackwillow Dr
- 4592 N Landing Dr
- 4314 Keheley Lake Ct NE
- 4281 Keheley Lake Dr NE
- 4797 North Trail
- 1634 Barrier Rd
- 4799 North Trail
- 4499 Browning Ct NE
- 4758 Jamerson Forest Cir
- 4181 Keheley Dr NE
- 1740 Latour Dr NE
- 4813 Highpoint Dr NE
- 4709 Trickum Rd NE
- 4924 Locklear Way
- 2011 Kemp Rd
- 2021 Kemp Rd
- 2001 Kemp Rd
- 4672 N Landing Dr Unit 3
- 2212 N Landing Run Unit 3
- 2206 N Landing Run
- 2000 Kemp Rd
- 1991 Kemp Rd
- 0 Kemp Rd NE Unit 8051652
- 0 Kemp Rd NE Unit 8675493
- 0 Kemp Rd NE Unit 8393407
- 0 Kemp Rd NE Unit 8312253
- 0 Kemp Rd NE Unit 3256878
- 0 Kemp Rd NE Unit 8387318
- 0 Kemp Rd NE Unit 8993396
- 0 Kemp Rd NE Unit 9023553
- 0 Kemp Rd NE Unit 9054848
- 0 Kemp Rd NE Unit 9078041
- 0 Kemp Rd NE Unit 9070085