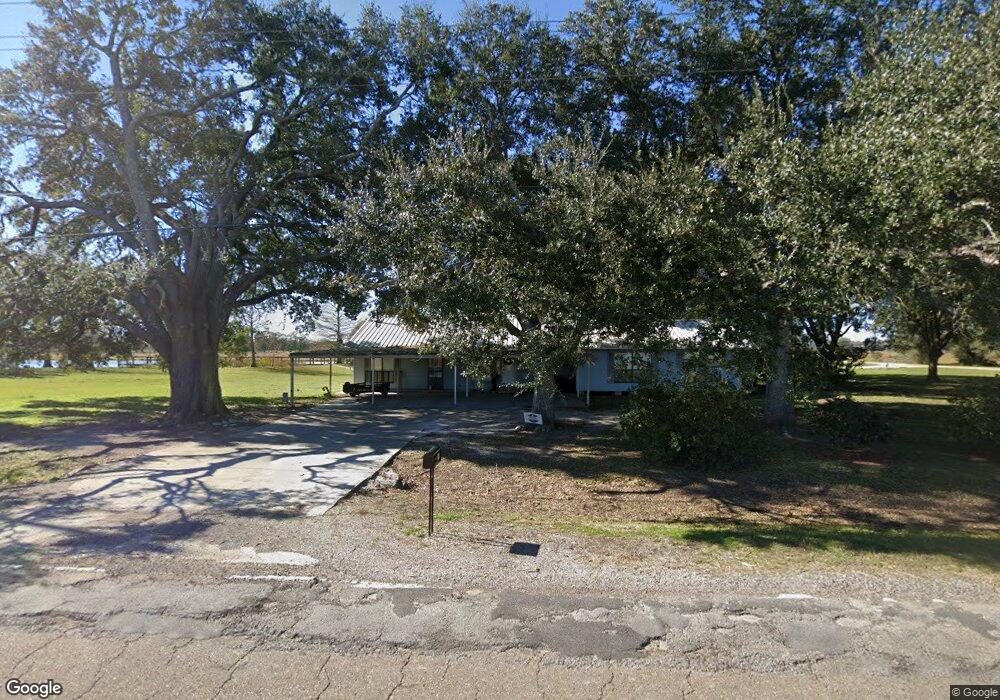
2011 Mills St Lafayette, LA 70507
Estimated Value: $316,800 - $392,000
4
Beds
2
Baths
2,242
Sq Ft
$154/Sq Ft
Est. Value
About This Home
This home is located at 2011 Mills St, Lafayette, LA 70507 and is currently estimated at $346,200, approximately $154 per square foot. 2011 Mills St is a home located in Lafayette Parish with nearby schools including Ossun Elementary School, Carencro Middle School, and Carencro High School.
Ownership History
Date
Name
Owned For
Owner Type
Purchase Details
Closed on
Jul 27, 2022
Sold by
Alan Hebert Jr Mark and Robbins Carrie
Bought by
Derouen Lauren Ann
Current Estimated Value
Home Financials for this Owner
Home Financials are based on the most recent Mortgage that was taken out on this home.
Original Mortgage
$225,000
Outstanding Balance
$215,564
Interest Rate
5.78%
Mortgage Type
New Conventional
Estimated Equity
$130,636
Purchase Details
Closed on
Nov 5, 2018
Sold by
Lyons Domingue Charles Wayne and Lyons Domingue Linda Marie
Bought by
Robbins Hebert Mark Alan and Robbins Hebert Carrie Ann
Home Financials for this Owner
Home Financials are based on the most recent Mortgage that was taken out on this home.
Original Mortgage
$256,987
Interest Rate
4.7%
Mortgage Type
New Conventional
Purchase Details
Closed on
Aug 20, 2010
Sold by
Lyons Domingue Linda Marie and Domingue Charles Wayne
Bought by
Hebert Mark Alan
Create a Home Valuation Report for This Property
The Home Valuation Report is an in-depth analysis detailing your home's value as well as a comparison with similar homes in the area
Home Values in the Area
Average Home Value in this Area
Purchase History
| Date | Buyer | Sale Price | Title Company |
|---|---|---|---|
| Derouen Lauren Ann | $340,000 | None Listed On Document | |
| Robbins Hebert Mark Alan | $270,506 | None Available | |
| Hebert Mark Alan | $12,500 | None Available |
Source: Public Records
Mortgage History
| Date | Status | Borrower | Loan Amount |
|---|---|---|---|
| Open | Derouen Lauren Ann | $225,000 | |
| Previous Owner | Robbins Hebert Mark Alan | $256,987 |
Source: Public Records
Tax History Compared to Growth
Tax History
| Year | Tax Paid | Tax Assessment Tax Assessment Total Assessment is a certain percentage of the fair market value that is determined by local assessors to be the total taxable value of land and additions on the property. | Land | Improvement |
|---|---|---|---|---|
| 2024 | $1,384 | $23,170 | $6,216 | $16,954 |
| 2023 | $1,384 | $20,733 | $4,739 | $15,994 |
| 2022 | $1,826 | $20,733 | $4,739 | $15,994 |
| 2021 | $1,833 | $20,733 | $4,739 | $15,994 |
| 2020 | $1,831 | $20,733 | $4,739 | $15,994 |
| 2019 | $1,111 | $20,733 | $4,739 | $15,994 |
| 2018 | $730 | $8,514 | $4,739 | $3,775 |
| 2017 | $729 | $8,514 | $4,739 | $3,775 |
| 2015 | $572 | $6,695 | $3,385 | $3,310 |
| 2013 | -- | $6,695 | $3,385 | $3,310 |
Source: Public Records
Map
Nearby Homes