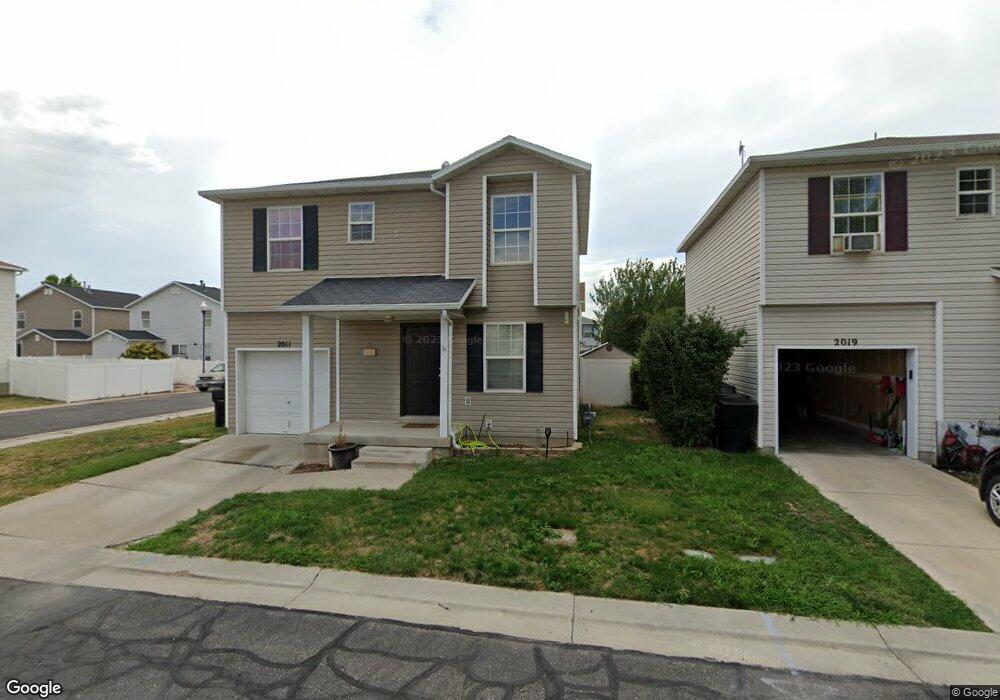
2011 N 2095 W Clearfield, UT 84015
Estimated Value: $365,000 - $413,000
3
Beds
2
Baths
1,359
Sq Ft
$283/Sq Ft
Est. Value
About This Home
This home is located at 2011 N 2095 W, Clearfield, UT 84015 and is currently estimated at $384,812, approximately $283 per square foot. 2011 N 2095 W is a home located in Davis County with nearby schools including Parkside Elementary School, West Point Junior High School, and Clearfield High School.
Ownership History
Date
Name
Owned For
Owner Type
Purchase Details
Closed on
Oct 21, 2022
Sold by
Brown Arthur G
Bought by
Underwood Remick Paul
Current Estimated Value
Home Financials for this Owner
Home Financials are based on the most recent Mortgage that was taken out on this home.
Original Mortgage
$353,479
Outstanding Balance
$342,100
Interest Rate
6.92%
Mortgage Type
FHA
Estimated Equity
$42,712
Purchase Details
Closed on
Aug 23, 2019
Sold by
Baldwin Brian and Baldwin Jessica
Bought by
Brown Arthur G
Home Financials for this Owner
Home Financials are based on the most recent Mortgage that was taken out on this home.
Original Mortgage
$226,000
Interest Rate
3.7%
Mortgage Type
VA
Purchase Details
Closed on
Nov 1, 2001
Sold by
Clinton Crossroads Llc
Bought by
Gonzalez Lindsey S and Jason Gonzalez G
Home Financials for this Owner
Home Financials are based on the most recent Mortgage that was taken out on this home.
Original Mortgage
$115,923
Interest Rate
6.84%
Create a Home Valuation Report for This Property
The Home Valuation Report is an in-depth analysis detailing your home's value as well as a comparison with similar homes in the area
Home Values in the Area
Average Home Value in this Area
Purchase History
| Date | Buyer | Sale Price | Title Company |
|---|---|---|---|
| Underwood Remick Paul | -- | Meraki Title | |
| Brown Arthur G | -- | First American Title | |
| Gonzalez Lindsey S | -- | First American Title Insuran |
Source: Public Records
Mortgage History
| Date | Status | Borrower | Loan Amount |
|---|---|---|---|
| Open | Underwood Remick Paul | $353,479 | |
| Previous Owner | Brown Arthur G | $226,000 | |
| Previous Owner | Gonzalez Lindsey S | $115,923 |
Source: Public Records
Tax History Compared to Growth
Tax History
| Year | Tax Paid | Tax Assessment Tax Assessment Total Assessment is a certain percentage of the fair market value that is determined by local assessors to be the total taxable value of land and additions on the property. | Land | Improvement |
|---|---|---|---|---|
| 2025 | $1,848 | $177,650 | $61,521 | $116,129 |
| 2024 | $1,889 | $182,600 | $69,768 | $112,832 |
| 2023 | $1,750 | $313,000 | $79,635 | $233,365 |
| 2022 | $1,339 | $180,400 | $53,629 | $126,771 |
| 2021 | $0 | $245,000 | $58,959 | $186,041 |
| 2020 | $1,339 | $211,000 | $46,201 | $164,799 |
| 2019 | $1,339 | $190,000 | $61,392 | $128,608 |
| 2018 | $1,270 | $177,000 | $52,892 | $124,108 |
| 2016 | $1,103 | $79,420 | $20,119 | $59,301 |
| 2015 | $1,078 | $73,810 | $20,119 | $53,691 |
| 2014 | $1,029 | $71,544 | $20,119 | $51,425 |
| 2013 | -- | $68,349 | $20,163 | $48,186 |
Source: Public Records
Map
Nearby Homes
- 2616 N 2125 W Unit 147
- 2083 W 2220 N
- 2184 N 2000 W
- 2162 N 2290 W
- 2164 W 2265 N
- 2259 W 1800 N
- 2377 W 2120 N
- 2318 N 2100 W
- 1694 N 2225 W
- Harvard Plan at Summerfield - Enclave
- 2208 W 2615 N
- Linden Plan at Summerfield - Vista
- Yale Plan at Summerfield - Enclave
- Gambel Oak Plan at Summerfield - Vista
- Cedar Plan at Summerfield - Vista
- Elm Plan at Summerfield - Vista
- Princeton Plan at Summerfield - Enclave
- Cambridge Plan at Summerfield - Enclave
- Cornell Plan at Summerfield - Enclave
- Sycamore Plan at Summerfield - Vista