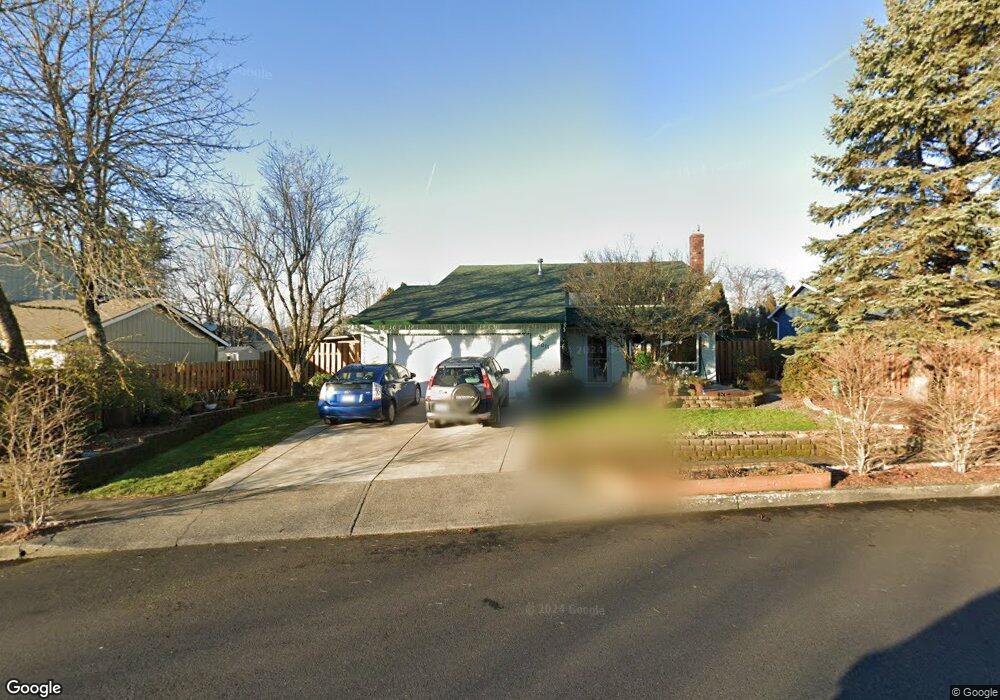
2011 NW 16th St Gresham, OR 97030
Northwest Gresham NeighborhoodEstimated Value: $426,000 - $473,000
3
Beds
2
Baths
1,417
Sq Ft
$318/Sq Ft
Est. Value
About This Home
This home is located at 2011 NW 16th St, Gresham, OR 97030 and is currently estimated at $450,519, approximately $317 per square foot. 2011 NW 16th St is a home located in Multnomah County with nearby schools including North Gresham Elementary School, Clear Creek Middle School, and Gresham High School.
Ownership History
Date
Name
Owned For
Owner Type
Purchase Details
Closed on
Aug 10, 2010
Sold by
Brown Susan M
Bought by
Brown Susan M and Feinberg Sander D
Current Estimated Value
Purchase Details
Closed on
Jun 29, 1998
Sold by
Kitatake Constance
Bought by
Brown Susan M
Home Financials for this Owner
Home Financials are based on the most recent Mortgage that was taken out on this home.
Original Mortgage
$128,700
Outstanding Balance
$24,994
Interest Rate
7.03%
Mortgage Type
Purchase Money Mortgage
Estimated Equity
$425,525
Purchase Details
Closed on
May 18, 1998
Sold by
Becchetti Robert and Kitatake Akihiro
Bought by
Kitatake Constance and Kitatake Akihiro
Home Financials for this Owner
Home Financials are based on the most recent Mortgage that was taken out on this home.
Original Mortgage
$128,700
Outstanding Balance
$24,994
Interest Rate
7.03%
Mortgage Type
Purchase Money Mortgage
Estimated Equity
$425,525
Purchase Details
Closed on
Sep 11, 1997
Sold by
Becchetti Robert
Bought by
Kitatake Constance and Kitatake Akihiro
Create a Home Valuation Report for This Property
The Home Valuation Report is an in-depth analysis detailing your home's value as well as a comparison with similar homes in the area
Home Values in the Area
Average Home Value in this Area
Purchase History
| Date | Buyer | Sale Price | Title Company |
|---|---|---|---|
| Brown Susan M | -- | None Available | |
| Brown Susan M | $143,000 | First American Title Ins Co | |
| Kitatake Constance | -- | -- | |
| Kitatake Constance | -- | -- |
Source: Public Records
Mortgage History
| Date | Status | Borrower | Loan Amount |
|---|---|---|---|
| Open | Brown Susan M | $128,700 |
Source: Public Records
Tax History
| Year | Tax Paid | Tax Assessment Tax Assessment Total Assessment is a certain percentage of the fair market value that is determined by local assessors to be the total taxable value of land and additions on the property. | Land | Improvement |
|---|---|---|---|---|
| 2025 | $5,050 | $248,140 | -- | -- |
| 2024 | $4,834 | $240,920 | -- | -- |
| 2023 | $4,834 | $233,910 | -- | -- |
| 2022 | $4,281 | $227,100 | $0 | $0 |
| 2021 | $4,173 | $220,490 | $0 | $0 |
| 2020 | $3,926 | $214,070 | $0 | $0 |
| 2019 | $3,824 | $207,840 | $0 | $0 |
| 2018 | $3,646 | $201,790 | $0 | $0 |
| 2017 | $3,498 | $195,920 | $0 | $0 |
| 2016 | $3,084 | $190,220 | $0 | $0 |
| 2015 | $3,018 | $184,680 | $0 | $0 |
| 2014 | $2,944 | $179,310 | $0 | $0 |
Source: Public Records
Map
Nearby Homes
- 1861 NW Wonderview Ave
- 1387 NW Riverview Ave Unit 14B
- 1811 NW 19th St
- 70 NW Birdsdale Ave
- 2013 NW Bella Vista Dr
- 21033 SE Clay Ct
- 970 NW Wonderview Ct Unit 980
- 1745 NW 7th Place
- 765 NW Angeline Ave
- 1325 NW 9th St
- 994 NW Wallula Ave
- 1026 SE 209th Ave
- 21001 SE Yamhill St
- 0 SE Burnside St
- 2095 NW 3rd St
- 805 SE 197th Ave
- 19776 SE Stark St Unit 147
- 21016 SE Stark St Unit 71
- 21016 SE Stark St Unit 69
- 920 SE 214th Ave
- 2025 NW 16th St
- 2001 NW 16th St
- 2074 NW 17th St
- 2058 NW 17th St
- 2092 NW 17th St
- 2039 NW 16th St
- 1933 NW 16th St
- 2010 NW 16th St
- 2012 NW 17th St
- 2096 NW 17th St
- 1988 NW 17th St
- 2022 NW 16th St
- 1921 NW 16th St
- 1928 NW 16th St
- 1624 NW Wonderview Ave
- 2047 NW 16th St
- 1666 NW Wonderview Ave
- 1704 NW Wonderview Ave
- 1593 NW Riverview Ave
- 2057 NW 17th St
Your Personal Tour Guide
Ask me questions while you tour the home.