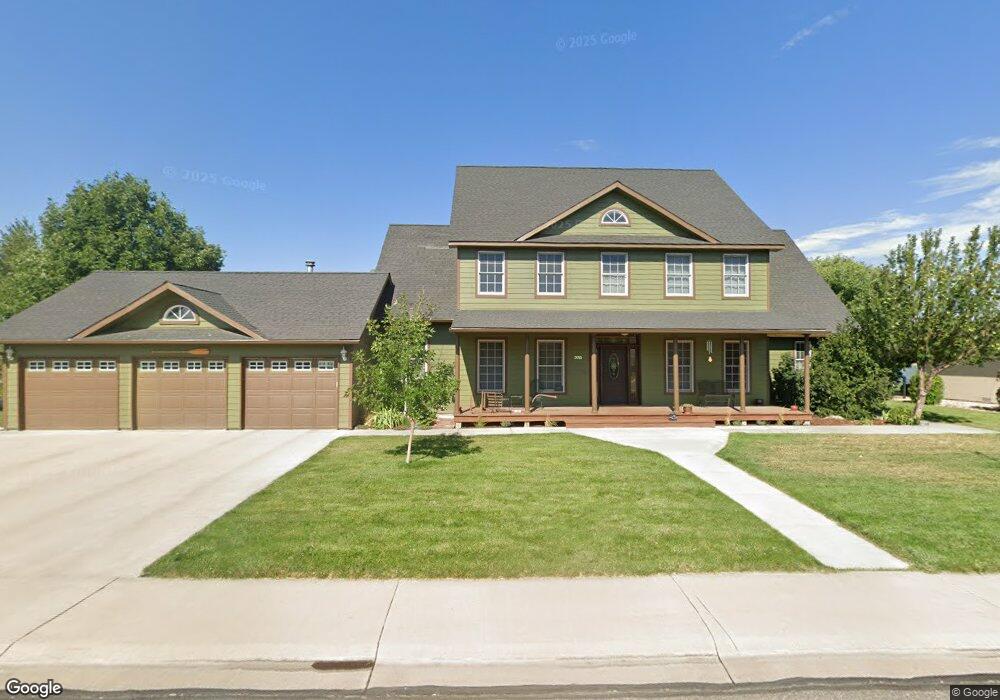
2011 Otter Pond Cir Montrose, CO 81401
Estimated Value: $864,000 - $898,000
5
Beds
4
Baths
3,488
Sq Ft
$252/Sq Ft
Est. Value
About This Home
This home is located at 2011 Otter Pond Cir, Montrose, CO 81401 and is currently estimated at $879,723, approximately $252 per square foot. 2011 Otter Pond Cir is a home located in Montrose County with nearby schools including Cottonwood Elementary School, Columbine Middle School, and Montrose High School.
Ownership History
Date
Name
Owned For
Owner Type
Purchase Details
Closed on
Jul 29, 2020
Sold by
Bell Kathleen R
Bought by
Clagett Thomas A and Clagett Melinda C
Current Estimated Value
Home Financials for this Owner
Home Financials are based on the most recent Mortgage that was taken out on this home.
Original Mortgage
$450,000
Outstanding Balance
$399,182
Interest Rate
3%
Mortgage Type
New Conventional
Estimated Equity
$480,541
Purchase Details
Closed on
Mar 11, 2005
Sold by
Bell Thomas W
Bought by
Bell Kathleen R
Purchase Details
Closed on
Apr 28, 2000
Sold by
Bell Thomas W
Bought by
Bell Kathleen R
Purchase Details
Closed on
Mar 16, 2000
Sold by
Crested Butte Global Investments Llc
Bought by
Bell Thomas W and Bell Kathleen R
Purchase Details
Closed on
Sep 20, 1999
Sold by
Otter Pond Lllp
Bought by
Crested Butte Global Investments Llc
Create a Home Valuation Report for This Property
The Home Valuation Report is an in-depth analysis detailing your home's value as well as a comparison with similar homes in the area
Home Values in the Area
Average Home Value in this Area
Purchase History
| Date | Buyer | Sale Price | Title Company |
|---|---|---|---|
| Clagett Thomas A | $570,000 | Fidelity National Title | |
| Bell Kathleen R | -- | None Available | |
| Bell Kathleen R | -- | -- | |
| Bell Thomas W | -- | -- | |
| Crested Butte Global Investments Llc | $52,000 | -- |
Source: Public Records
Mortgage History
| Date | Status | Borrower | Loan Amount |
|---|---|---|---|
| Open | Clagett Thomas A | $450,000 |
Source: Public Records
Tax History Compared to Growth
Tax History
| Year | Tax Paid | Tax Assessment Tax Assessment Total Assessment is a certain percentage of the fair market value that is determined by local assessors to be the total taxable value of land and additions on the property. | Land | Improvement |
|---|---|---|---|---|
| 2024 | $4,275 | $55,880 | $9,430 | $46,450 |
| 2023 | $4,275 | $61,800 | $10,430 | $51,370 |
| 2022 | $2,972 | $42,580 | $6,950 | $35,630 |
| 2021 | $3,061 | $43,810 | $7,150 | $36,660 |
| 2020 | $1,940 | $35,680 | $5,710 | $29,970 |
| 2019 | $1,952 | $35,680 | $5,710 | $29,970 |
| 2018 | $2,000 | $35,680 | $4,790 | $30,890 |
| 2017 | $1,984 | $35,680 | $4,790 | $30,890 |
| 2016 | $1,782 | $33,970 | $4,820 | $29,150 |
| 2015 | $2,287 | $33,970 | $4,820 | $29,150 |
| 2014 | $1,976 | $31,380 | $4,820 | $26,560 |
Source: Public Records
Map
Nearby Homes
- TBD Otter Pond Cir
- TBD Lot 1 Woodgate Rd
- TBD Lot 3 Woodgate Rd
- TBD Lot 2-2 Woodgate Rd
- TBD Lot 2 Woodgate Rd
- TBD Lot 2-3 Woodgate Rd
- TBD Lot 2-1 Woodgate Rd
- 3038 Glacier Dr
- TBD Oxbow Dr
- 1728 Keller Ct
- Lot 14 Teton Ct
- 1712 Keller Ct
- TBD Woodgate Rd
- 2820 Glacier Dr
- 2802 Glacier Dr
- TBD Odelle Rd
- 2900 Sleeping Bear Rd
- 66460 Ogden Rd
- Lot 1928 Sleeping Bear Rd
- TBD Torrence Dr
- 2009 Otter Pond Cir
- 2013 Otter Pond Cir
- 2014 Otter Pond Cir
- 2012 Otter Pond Cir
- 0 Otter Pond Cir Unit 826809
- 0 Otter Pond Cir Unit 597212
- 0 Otter Pond Cir Unit 603813
- 0 Otter Pond Cir Unit 602266
- 0 Otter Pond Cir Unit 616526
- 0 Otter Pond Cir Unit 618334
- 0 Otter Pond Cir Unit 639345
- 0 Otter Pond Cir Unit 641759
- 0 Otter Pond Cir Unit 643464
- 0 Otter Pond Cir Unit 644569
- 0 Otter Pond Cir Unit 644925
- 0 Otter Pond Cir Unit 646881
- 0 Otter Pond Cir Unit 602452
- 0 Otter Pond Cir Unit 653816
- 0 Otter Pond Cir Unit 655579
- 0 Otter Pond Cir Unit 658289