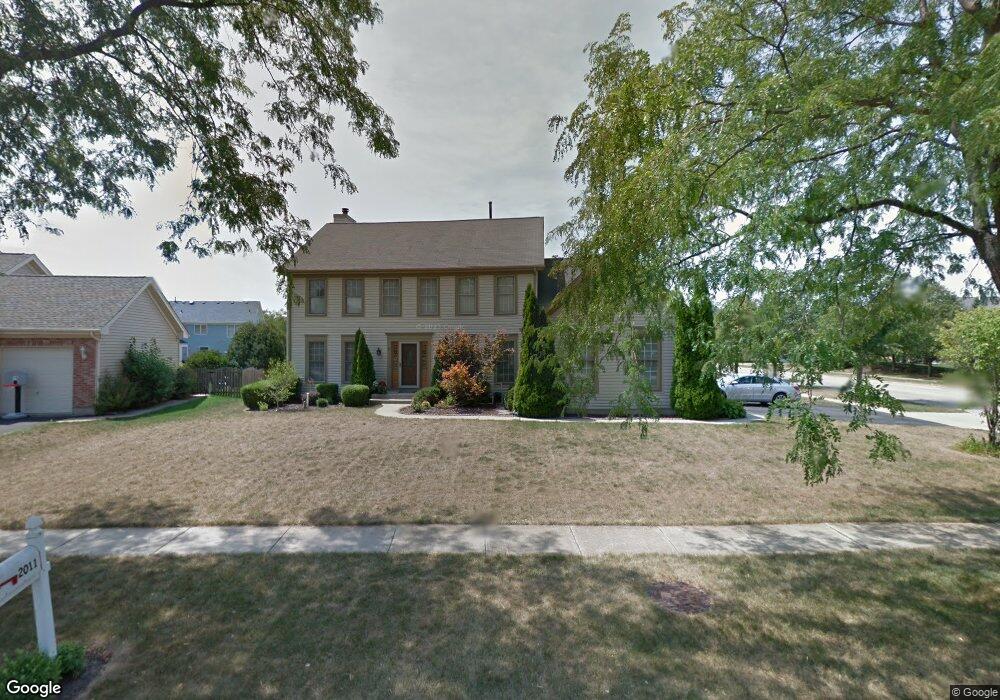
2011 Peach Tree Ln Algonquin, IL 60102
Estimated Value: $444,848 - $545,000
4
Beds
--
Bath
2,401
Sq Ft
$200/Sq Ft
Est. Value
About This Home
This home is located at 2011 Peach Tree Ln, Algonquin, IL 60102 and is currently estimated at $480,962, approximately $200 per square foot. 2011 Peach Tree Ln is a home located in Kane County with nearby schools including Westfield Community School and Harry D Jacobs High School.
Ownership History
Date
Name
Owned For
Owner Type
Purchase Details
Closed on
Aug 23, 2000
Sold by
Pmi Mtg Insurance Company
Bought by
Bussa Douglas J and Bussa Rosemary Traska
Current Estimated Value
Home Financials for this Owner
Home Financials are based on the most recent Mortgage that was taken out on this home.
Original Mortgage
$150,000
Outstanding Balance
$54,120
Interest Rate
8.15%
Estimated Equity
$426,842
Purchase Details
Closed on
May 12, 2000
Sold by
Cetwinski Nicholas G and Cetwinski Maureen L
Bought by
Federal Home Loan Mortgage Corporation
Purchase Details
Closed on
Apr 1, 1996
Sold by
Conner John Timothy and Conner Lana Gail
Bought by
Cetwinski Nicholas G and Cetwinski Maureen L
Home Financials for this Owner
Home Financials are based on the most recent Mortgage that was taken out on this home.
Original Mortgage
$195,200
Interest Rate
8.13%
Create a Home Valuation Report for This Property
The Home Valuation Report is an in-depth analysis detailing your home's value as well as a comparison with similar homes in the area
Purchase History
| Date | Buyer | Sale Price | Title Company |
|---|---|---|---|
| Bussa Douglas J | $230,000 | Universal Title Services Inc | |
| Federal Home Loan Mortgage Corporation | -- | Wheatland Title | |
| Cetwinski Nicholas G | $205,500 | First American Title Ins Co |
Source: Public Records
Mortgage History
| Date | Status | Borrower | Loan Amount |
|---|---|---|---|
| Open | Bussa Douglas J | $150,000 | |
| Previous Owner | Cetwinski Nicholas G | $195,200 |
Source: Public Records
Tax History
| Year | Tax Paid | Tax Assessment Tax Assessment Total Assessment is a certain percentage of the fair market value that is determined by local assessors to be the total taxable value of land and additions on the property. | Land | Improvement |
|---|---|---|---|---|
| 2024 | $9,042 | $134,920 | $26,492 | $108,428 |
| 2023 | $8,578 | $121,397 | $23,837 | $97,560 |
| 2022 | $8,066 | $107,520 | $23,837 | $83,683 |
| 2021 | $8,237 | $101,520 | $22,507 | $79,013 |
| 2020 | $8,077 | $99,238 | $22,001 | $77,237 |
| 2019 | $7,832 | $94,208 | $20,886 | $73,322 |
| 2018 | $7,961 | $92,342 | $20,472 | $71,870 |
| 2017 | $7,642 | $86,382 | $19,151 | $67,231 |
| 2016 | $7,457 | $79,857 | $18,543 | $61,314 |
| 2015 | -- | $72,689 | $17,040 | $55,649 |
| 2014 | -- | $67,813 | $16,569 | $51,244 |
| 2013 | -- | $69,889 | $17,076 | $52,813 |
Source: Public Records
Map
Nearby Homes
- 20 Peach Tree Ct Unit 4153
- 18 Peach Tree Ct Unit 4154
- 2069 Peach Tree Ln Unit 4116
- 1900 Waverly Ln
- 2051 Carlisle St
- 1239 Glenmont St
- 1141 Glenmont St
- 1157 Sawmill Ln
- 1002 Interloch Ct Unit 152
- 2224 Barrett Dr
- 1090 Glenmont St
- 1247 Glenmont St
- 1250 Glenmont St
- 1241 Glenmont St
- 1111 Glenmont St
- 1243 Glenmont St
- 1080 Glenmont St
- 1030 Glenmont St
- 1249 Glenmont St
- 1245 Glenmont St
- 2001 Peach Tree Ln
- 2040 Cloverdale Ln
- 2030 Cloverdale Ln
- 2021 Peach Tree Ln Unit 4131
- 2023 Peach Tree Ln Unit 4132
- 2025 Peach Tree Ln Unit 4133
- 1981 Peach Tree Ln Unit 3
- 2020 Cloverdale Ln
- 2031 Peach Tree Ln Unit 4134
- 2000 Peach Tree Ln
- 2010 Cloverdale Ln Unit 4
- 2 Cloverdale Ct Unit 4056
- 8 Peach Tree Ct Unit 4141
- 28 Peach Tree Ct Unit 4162
- 4 Peach Tree Ct Unit 4143
- 2 Peach Tree Ct Unit 4144
- 6 Peach Tree Ct Unit 4142
- 8 Cloverdale Ct Unit 4053
- 4 Cloverdale Ct Unit 4055
- 12 Cloverdale Ct Unit 12
Your Personal Tour Guide
Ask me questions while you tour the home.