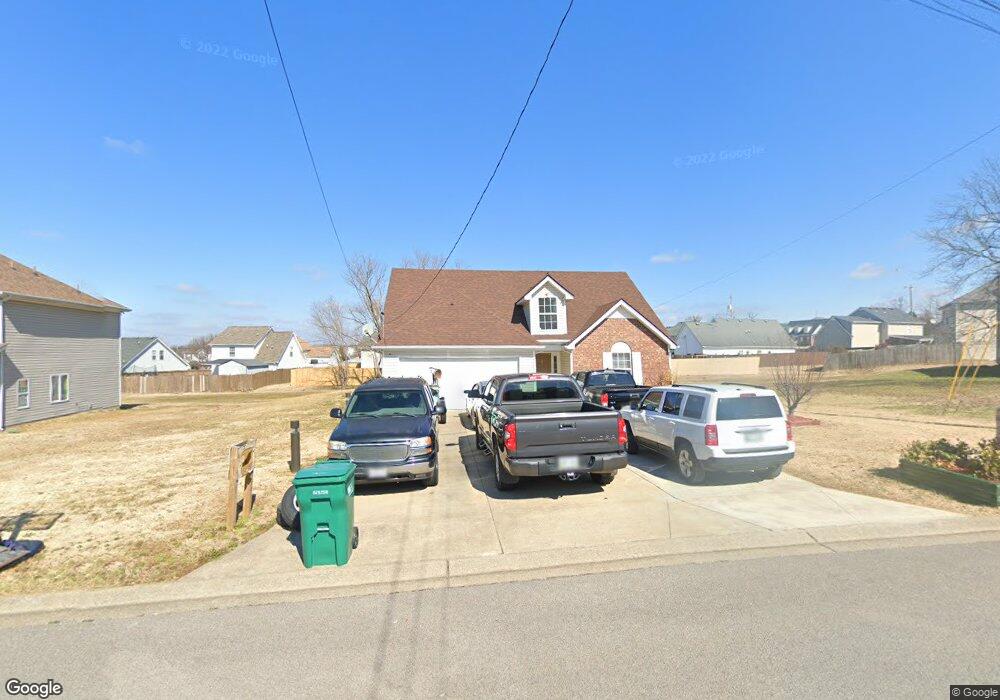
2011 Pearson Ln La Vergne, TN 37086
Estimated Value: $299,294 - $363,000
--
Bed
2
Baths
1,264
Sq Ft
$264/Sq Ft
Est. Value
About This Home
This home is located at 2011 Pearson Ln, La Vergne, TN 37086 and is currently estimated at $333,824, approximately $264 per square foot. 2011 Pearson Ln is a home located in Rutherford County with nearby schools including LaVergne Lake Elementary School, La Vergne Middle School, and Lavergne High School.
Ownership History
Date
Name
Owned For
Owner Type
Purchase Details
Closed on
Apr 30, 2015
Sold by
Jillian & Louis Properties Iii
Bought by
Esparza Monica B and Saldana Nicolas
Current Estimated Value
Home Financials for this Owner
Home Financials are based on the most recent Mortgage that was taken out on this home.
Original Mortgage
$110,700
Outstanding Balance
$85,649
Interest Rate
3.8%
Mortgage Type
New Conventional
Estimated Equity
$248,175
Purchase Details
Closed on
Mar 29, 2013
Sold by
My Beautiful Home Llc
Bought by
Jillian & Louis Properties Iii
Purchase Details
Closed on
Oct 12, 2012
Sold by
Jillian
Bought by
My Beautiful Home Llc
Purchase Details
Closed on
Aug 16, 2009
Sold by
Falzetti Louis
Bought by
Jillian
Purchase Details
Closed on
Apr 20, 2007
Sold by
Novastar Mortgage Inc
Bought by
Falzetti and Jill
Purchase Details
Closed on
Nov 17, 2006
Sold by
Sample Donald A
Bought by
Novastar Mortgage
Create a Home Valuation Report for This Property
The Home Valuation Report is an in-depth analysis detailing your home's value as well as a comparison with similar homes in the area
Home Values in the Area
Average Home Value in this Area
Purchase History
| Date | Buyer | Sale Price | Title Company |
|---|---|---|---|
| Esparza Monica B | $123,000 | -- | |
| Jillian & Louis Properties Iii | -- | -- | |
| My Beautiful Home Llc | -- | -- | |
| Jillian | -- | -- | |
| Falzetti | $117,500 | -- | |
| Novastar Mortgage | $117,441 | -- | |
| Novastar Mortgage | $117,441 | -- |
Source: Public Records
Mortgage History
| Date | Status | Borrower | Loan Amount |
|---|---|---|---|
| Open | Esparza Monica B | $110,700 |
Source: Public Records
Tax History Compared to Growth
Tax History
| Year | Tax Paid | Tax Assessment Tax Assessment Total Assessment is a certain percentage of the fair market value that is determined by local assessors to be the total taxable value of land and additions on the property. | Land | Improvement |
|---|---|---|---|---|
| 2025 | $1,526 | $63,250 | $13,750 | $49,500 |
| 2024 | $1,526 | $63,250 | $13,750 | $49,500 |
| 2023 | $1,187 | $63,250 | $13,750 | $49,500 |
| 2022 | $1,022 | $63,250 | $13,750 | $49,500 |
| 2021 | $955 | $43,025 | $10,000 | $33,025 |
| 2020 | $955 | $43,025 | $10,000 | $33,025 |
| 2019 | $955 | $43,025 | $10,000 | $33,025 |
| 2018 | $1,208 | $43,025 | $0 | $0 |
| 2017 | $1,113 | $30,675 | $0 | $0 |
| 2016 | $1,113 | $30,675 | $0 | $0 |
| 2015 | $1,121 | $30,675 | $0 | $0 |
| 2014 | -- | $30,675 | $0 | $0 |
| 2013 | -- | $31,300 | $0 | $0 |
Source: Public Records
Map
Nearby Homes
- 2015 Keaton Dr
- 1119 Moss Trail
- 613 Sycamore Ln
- 4004 George Buchanan
- 4007 George Buchanan
- 3038 Rg Buchanan Dr
- 102 Freeboard Alley
- 327 Delta Way
- 317 Delta Way
- 311 Delta Way
- 305 Delta Way
- 319 Delta Way
- 325 Delta Way
- 307 Delta Way
- 122 Waldron Cir
- 4237 Miranda Place
- 427 Rick McCormick Dr
- 152 Bluegill Ln
- 148 Bluegill Ln
- 150 Bluegill Ln
- 2009 Pearson Ln
- 211 Floyd Mayfield Dr
- 1006 Anna Gannon Dr
- 1008 Anna Gannon Dr
- 1004 Anna Gannon Dr
- 2020 Pearson Ln
- 2005 Pearson Ln
- 2022 Pearson Ln
- 213 Floyd Mayfield Dr
- 1010 Anna Gannon Dr
- 2007 Pearson Ln
- 2018 Pearson Ln
- 1002 Anna Gannon Dr
- 2016 Pearson Ln
- 1012 Anna Gannon Dr
- 208 Floyd Mayfield Dr
- 1007 Anna Gannon Dr
- 210 Floyd Mayfield Dr
- 915 Tal Ln
- 1005 Anna Gannon Dr