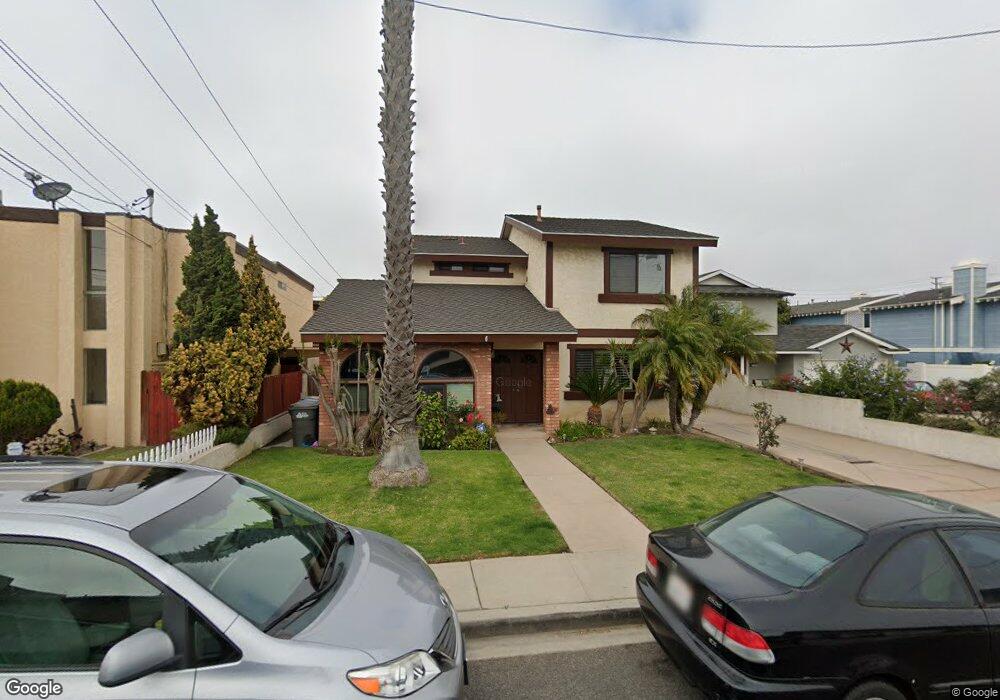
2011 Pullman Ln Unit A Redondo Beach, CA 90278
North Redondo Beach NeighborhoodEstimated Value: $1,271,666 - $1,440,000
3
Beds
3
Baths
1,968
Sq Ft
$684/Sq Ft
Est. Value
About This Home
This home is located at 2011 Pullman Ln Unit A, Redondo Beach, CA 90278 and is currently estimated at $1,346,167, approximately $684 per square foot. 2011 Pullman Ln Unit A is a home located in Los Angeles County with nearby schools including Jefferson Elementary School, Parras (Nick G.) Middle School, and Redondo Union High School.
Ownership History
Date
Name
Owned For
Owner Type
Purchase Details
Closed on
Nov 8, 2001
Sold by
Manko Gerald A and Manko Gloria
Bought by
Manko Gerald A
Current Estimated Value
Home Financials for this Owner
Home Financials are based on the most recent Mortgage that was taken out on this home.
Original Mortgage
$275,000
Interest Rate
6.57%
Purchase Details
Closed on
May 17, 1994
Sold by
Manko Gerald A and Manko Gloria H
Bought by
Manko Gerald A
Create a Home Valuation Report for This Property
The Home Valuation Report is an in-depth analysis detailing your home's value as well as a comparison with similar homes in the area
Home Values in the Area
Average Home Value in this Area
Purchase History
| Date | Buyer | Sale Price | Title Company |
|---|---|---|---|
| Manko Gerald A | -- | Commonwealth Title | |
| Manko Gerald A | -- | -- |
Source: Public Records
Mortgage History
| Date | Status | Borrower | Loan Amount |
|---|---|---|---|
| Previous Owner | Manko Gerald A | $275,000 |
Source: Public Records
Tax History
| Year | Tax Paid | Tax Assessment Tax Assessment Total Assessment is a certain percentage of the fair market value that is determined by local assessors to be the total taxable value of land and additions on the property. | Land | Improvement |
|---|---|---|---|---|
| 2025 | $8,986 | $715,460 | $469,978 | $245,482 |
| 2024 | $8,590 | $701,432 | $460,763 | $240,669 |
| 2023 | $8,437 | $687,679 | $451,729 | $235,950 |
| 2022 | $8,282 | $674,196 | $442,872 | $231,324 |
| 2021 | $8,053 | $660,978 | $434,189 | $226,789 |
| 2020 | $8,038 | $654,201 | $429,737 | $224,464 |
| 2019 | $7,855 | $641,374 | $421,311 | $220,063 |
| 2018 | $7,615 | $628,799 | $413,050 | $215,749 |
| 2016 | $7,361 | $604,383 | $397,011 | $207,372 |
| 2015 | $7,229 | $595,306 | $391,048 | $204,258 |
| 2014 | $7,126 | $583,645 | $383,388 | $200,257 |
Source: Public Records
Map
Nearby Homes
- 2001 Speyer Ln
- 902 Green Ln
- 2114 Clark Ln
- 2111 Clark Ln Unit A
- 2111 Clark Ln Unit B
- 2203 Marshallfield Ln Unit A
- 2203 Marshallfield Ln Unit B
- 2205 Marshallfield Ln Unit B
- 2205 Marshallfield Ln Unit A
- 1808 Pullman Ln Unit B
- 2018 Grant Ave Unit A
- 2105 Havemeyer Ln
- 2301 Marshallfield Ln Unit A
- 531 Rindge Ln
- 2214 Fisher Ct
- 2220 Huntington Ln Unit 4
- 1113 Ford Ave
- 1729 Harriman Ln Unit A
- 1836 Rockefeller Ln
- 1905 Rockefeller Ln Unit A
- 2011 Pullman Ln Unit B
- 2013 Pullman Ln
- 2009 Pullman Ln
- 2015 Pullman Ln Unit B
- 2015 Pullman Ln Unit A
- 2007 Pullman Ln Unit 2
- 2007 Pullman Ln Unit 1
- 2007 Pullman Ln
- 2017 Pullman Ln Unit B
- 2017 Pullman Ln Unit A
- 2005 Pullman Ln Unit 2
- 2005 Pullman Ln
- 2010 Marshallfield Ln Unit A
- 2010 Marshallfield Ln
- 2008 Marshallfield Ln
- 2012 Marshallfield Ln
- 2014 Marshallfield Ln
- 2006 Marshallfield Ln
- 2010 Pullman Ln
- 2019 Pullman Ln Unit A
Your Personal Tour Guide
Ask me questions while you tour the home.