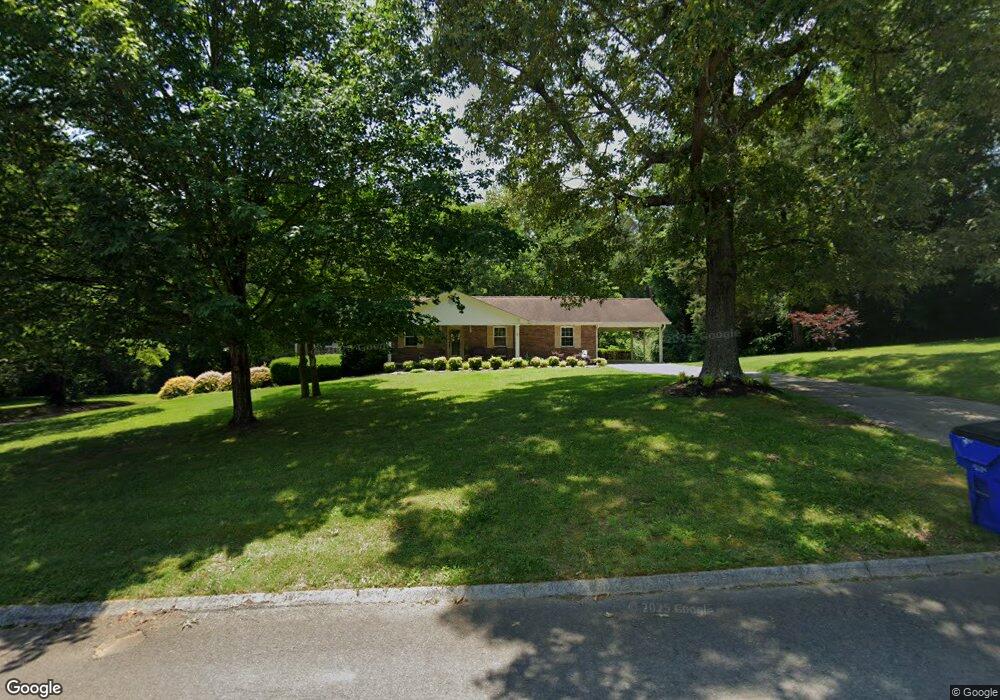
2011 Ridgewood Dr Jefferson City, TN 37760
Estimated Value: $406,883 - $537,000
--
Bed
3
Baths
1,769
Sq Ft
$260/Sq Ft
Est. Value
About This Home
This home is located at 2011 Ridgewood Dr, Jefferson City, TN 37760 and is currently estimated at $460,471, approximately $260 per square foot. 2011 Ridgewood Dr is a home located in Jefferson County with nearby schools including Jefferson Montessori School and Heritage Christian Academy.
Ownership History
Date
Name
Owned For
Owner Type
Purchase Details
Closed on
Jul 31, 2009
Sold by
Light Gary
Bought by
Light Gary
Current Estimated Value
Home Financials for this Owner
Home Financials are based on the most recent Mortgage that was taken out on this home.
Original Mortgage
$167,378
Interest Rate
5.26%
Purchase Details
Closed on
Jul 7, 2005
Sold by
Gary Young
Bought by
Gary Light
Home Financials for this Owner
Home Financials are based on the most recent Mortgage that was taken out on this home.
Original Mortgage
$138,500
Interest Rate
5.54%
Purchase Details
Closed on
Jun 11, 2002
Sold by
Mark Kimmins
Bought by
Gary Young
Home Financials for this Owner
Home Financials are based on the most recent Mortgage that was taken out on this home.
Original Mortgage
$96,900
Interest Rate
6.77%
Purchase Details
Closed on
Aug 26, 1997
Sold by
Bork Donald A and Bork Melissa A
Bought by
Mark Kimmins
Purchase Details
Closed on
Jan 1, 1983
Bought by
Bork Donald A and Bork Melissa A
Purchase Details
Closed on
Jan 1, 1982
Create a Home Valuation Report for This Property
The Home Valuation Report is an in-depth analysis detailing your home's value as well as a comparison with similar homes in the area
Home Values in the Area
Average Home Value in this Area
Purchase History
| Date | Buyer | Sale Price | Title Company |
|---|---|---|---|
| Light Gary | -- | -- | |
| Gary Light | $173,500 | -- | |
| Gary Young | $156,900 | -- | |
| Mark Kimmins | $143,000 | -- | |
| Bork Donald A | $88,900 | -- | |
| -- | $75,000 | -- |
Source: Public Records
Mortgage History
| Date | Status | Borrower | Loan Amount |
|---|---|---|---|
| Closed | Not Available | $167,378 | |
| Previous Owner | Not Available | $138,500 | |
| Previous Owner | Not Available | $96,900 |
Source: Public Records
Tax History Compared to Growth
Tax History
| Year | Tax Paid | Tax Assessment Tax Assessment Total Assessment is a certain percentage of the fair market value that is determined by local assessors to be the total taxable value of land and additions on the property. | Land | Improvement |
|---|---|---|---|---|
| 2025 | $1,270 | $93,350 | $9,500 | $83,850 |
| 2023 | $1,270 | $55,200 | $0 | $0 |
| 2022 | $1,209 | $55,200 | $8,000 | $47,200 |
| 2021 | $1,209 | $55,200 | $8,000 | $47,200 |
| 2020 | $1,209 | $55,200 | $8,000 | $47,200 |
| 2019 | $1,209 | $55,200 | $8,000 | $47,200 |
| 2018 | $1,107 | $47,100 | $7,000 | $40,100 |
| 2017 | $1,107 | $47,100 | $7,000 | $40,100 |
| 2016 | $1,107 | $47,100 | $7,000 | $40,100 |
| 2015 | $1,107 | $47,100 | $7,000 | $40,100 |
| 2014 | $1,107 | $47,100 | $7,000 | $40,100 |
Source: Public Records
Map
Nearby Homes
- 162 Lakeshore Bay
- 178 Lakeshore Bay Dr
- 179 Lakeshore Bay Dr
- 182 Lakeshore Bay Dr
- 174 Lakeshore Bay Dr
- 1806 Paul Dr
- 0 Eagle Ridge Ln
- 848 Navajo Dr
- 1835 Paul Dr
- 903 Julianne Dr
- 819 Navajo Dr
- 1916 N Sizer Ave
- 1825 Burnette Ave
- 1330 Collins Rd
- 1681 Mill Springs Rd
- 1905 Walnut Ave
- 902 N College St
- 724 E Jefferson St
- 807 E Ellis St
- 720 Carson St
- 2005 Ridgewood Dr
- 2008 Ridgewood Dr
- 154 Lakeshore Bay
- 2014 Ridgewood Dr
- 2021 Ridgewood Dr
- 2000 Ridgewood Dr
- 1945 Old Walnut Ln
- 1941 Old Walnut Ln
- 2020 Ridgewood Dr
- 1981 Ridgewood Dr
- 159 Lakeshore Bay Rd
- 1992 Ridgewood Dr
- 1939 Old Walnut Ln
- 1940 Old Walnut Ln
- 2028 Ridgewood Dr
- 199 Lakeshore Bay Rd
- 203 Lakeshore Bay Rd
- 178 Lakeshore Bay Rd
- 191 Lakeshore Bay Rd
- Lot 48 Lakeshore Bay Rd