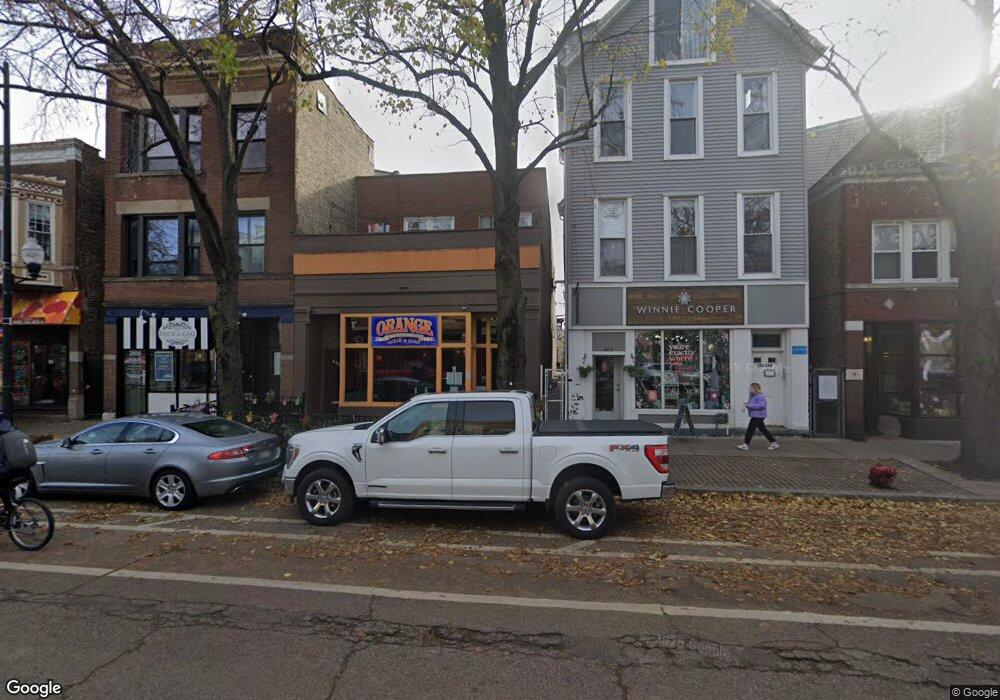
2011 W Roscoe St Unit 2 Chicago, IL 60618
Roscoe Village NeighborhoodEstimated Value: $1,147,580 - $1,230,000
2
Beds
1
Bath
1,200
Sq Ft
$984/Sq Ft
Est. Value
About This Home
This home is located at 2011 W Roscoe St Unit 2, Chicago, IL 60618 and is currently estimated at $1,180,860, approximately $984 per square foot. 2011 W Roscoe St Unit 2 is a home located in Cook County with nearby schools including John James Audubon Elementary School, Lake View High School, and Saint Andrew School.
Ownership History
Date
Name
Owned For
Owner Type
Purchase Details
Closed on
Mar 29, 2022
Sold by
Delta Tau Chi Llc
Bought by
Rcb Property Holdings Llc
Current Estimated Value
Home Financials for this Owner
Home Financials are based on the most recent Mortgage that was taken out on this home.
Original Mortgage
$768,000
Interest Rate
3.85%
Purchase Details
Closed on
Nov 27, 2013
Sold by
2011 West Roscoe Street Llc
Bought by
Delta Tau Chi Llc
Home Financials for this Owner
Home Financials are based on the most recent Mortgage that was taken out on this home.
Original Mortgage
$2,100,000
Interest Rate
3.25%
Mortgage Type
Commercial
Purchase Details
Closed on
May 2, 2007
Sold by
2011 West Roscoe Llc
Bought by
2011 West Roscoe Street Llc
Purchase Details
Closed on
Jun 30, 2001
Sold by
Vacha Charles
Bought by
Vacha Charles
Purchase Details
Closed on
May 24, 2001
Sold by
Firstar Bank Na
Bought by
2011 W Roscoe Ltd Partnership
Create a Home Valuation Report for This Property
The Home Valuation Report is an in-depth analysis detailing your home's value as well as a comparison with similar homes in the area
Home Values in the Area
Average Home Value in this Area
Purchase History
| Date | Buyer | Sale Price | Title Company |
|---|---|---|---|
| Rcb Property Holdings Llc | $960,000 | -- | |
| Delta Tau Chi Llc | -- | Fidelity Natl Title Ins Co | |
| 2011 West Roscoe Street Llc | $1,025,000 | Multiple | |
| Vacha Charles | -- | -- | |
| 2011 W Roscoe Ltd Partnership | -- | -- |
Source: Public Records
Mortgage History
| Date | Status | Borrower | Loan Amount |
|---|---|---|---|
| Closed | Rcb Property Holdings Llc | $768,000 | |
| Closed | Rcb Property Holdings Llc | $960,000 | |
| Previous Owner | Delta Tau Chi Llc | $2,100,000 |
Source: Public Records
Tax History Compared to Growth
Tax History
| Year | Tax Paid | Tax Assessment Tax Assessment Total Assessment is a certain percentage of the fair market value that is determined by local assessors to be the total taxable value of land and additions on the property. | Land | Improvement |
|---|---|---|---|---|
| 2024 | $16,457 | $95,353 | $46,500 | $48,853 |
| 2023 | $16,043 | $78,000 | $37,500 | $40,500 |
| 2022 | $16,043 | $78,000 | $37,500 | $40,500 |
| 2021 | $15,685 | $78,000 | $37,500 | $40,500 |
| 2020 | $14,271 | $64,063 | $15,600 | $48,463 |
| 2019 | $16,806 | $83,647 | $15,600 | $68,047 |
| 2018 | $16,832 | $85,210 | $15,600 | $69,610 |
| 2017 | $11,620 | $53,979 | $13,800 | $40,179 |
| 2016 | $10,811 | $53,979 | $13,800 | $40,179 |
| 2015 | $9,891 | $53,979 | $13,800 | $40,179 |
| 2014 | $9,858 | $53,131 | $10,800 | $42,331 |
| 2013 | $9,663 | $53,131 | $10,800 | $42,331 |
Source: Public Records
Map
Nearby Homes
- 3342 N Hoyne Ave
- 3306 N Hoyne Ave
- 3302 N Hoyne Ave
- 2034 W Melrose St
- 1931 W Cornelia Ave
- 3418 N Hamilton Ave
- 2144 W Roscoe St Unit 2B
- 3418 N Wolcott Ave Unit 1
- 2118 W Melrose St
- 1955 W Melrose St Unit 2
- 1938 W Belmont Ave Unit 2
- 2027 W Belmont Ave Unit 1
- 2011 W Belmont Ave Unit 208
- 2140 W Belmont Ave Unit 1
- 1935 W Belmont Ave Unit 2
- 2237 W Roscoe St Unit 2W
- 3137 N Hoyne Ave
- 2147 W Addison St
- 3615 N Hoyne Ave Unit 2F
- 2239 W Cornelia Ave
- 2011 W Roscoe St
- 2009 W Roscoe St Unit 2
- 2009 W Roscoe St Unit 2
- 2013 W Roscoe St
- 2013 W Roscoe St Unit 3
- 2013 W Roscoe St
- 2013 W Roscoe St Unit 2
- 2015 W Roscoe St
- 2005 W Roscoe St
- 2017 W Roscoe St Unit 2
- 2017 W Roscoe St Unit 3
- 2017 W Roscoe St Unit 1
- 3342 N Damen Ave
- 2021 W Roscoe St
- 2023 W Roscoe St Unit 1R
- 2023 W Roscoe St Unit 3F
- 2023 W Roscoe St Unit 3R
- 2023 W Roscoe St Unit 2F
- 3340 N Damen Ave