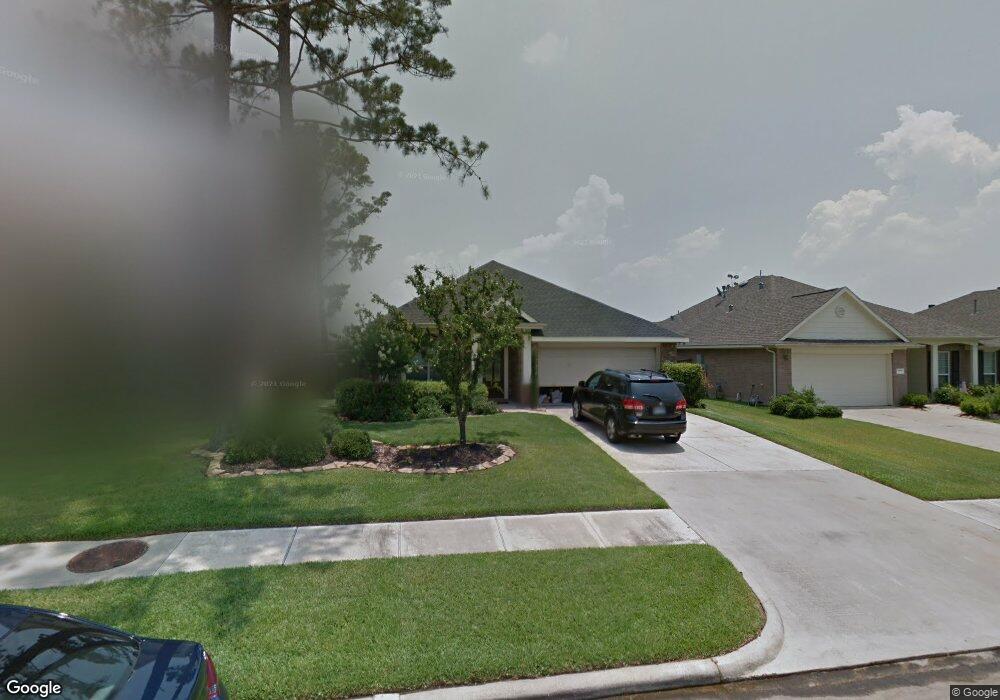
20110 Gunters Ridge Dr Spring, TX 77379
Gleannloch Farms NeighborhoodEstimated Value: $346,412 - $375,000
3
Beds
2
Baths
1,974
Sq Ft
$180/Sq Ft
Est. Value
About This Home
This home is located at 20110 Gunters Ridge Dr, Spring, TX 77379 and is currently estimated at $356,103, approximately $180 per square foot. 20110 Gunters Ridge Dr is a home located in Harris County with nearby schools including Frank Elementary School, Doerre Intermediate School, and Klein Cain High School.
Ownership History
Date
Name
Owned For
Owner Type
Purchase Details
Closed on
Oct 23, 2017
Sold by
Wilson Britt Pamela J and Wilson Pamela J
Bought by
Morin Kathy Pillow
Current Estimated Value
Home Financials for this Owner
Home Financials are based on the most recent Mortgage that was taken out on this home.
Original Mortgage
$188,000
Outstanding Balance
$156,864
Interest Rate
3.78%
Mortgage Type
New Conventional
Estimated Equity
$199,239
Purchase Details
Closed on
Jul 31, 2009
Sold by
Jernigan Kari
Bought by
Wilson Britt Pamela J
Home Financials for this Owner
Home Financials are based on the most recent Mortgage that was taken out on this home.
Original Mortgage
$160,047
Interest Rate
5.31%
Mortgage Type
FHA
Purchase Details
Closed on
Jul 28, 2006
Sold by
Weekley Homes Lp
Bought by
Jernigan Kari
Home Financials for this Owner
Home Financials are based on the most recent Mortgage that was taken out on this home.
Original Mortgage
$143,250
Interest Rate
6.66%
Mortgage Type
Purchase Money Mortgage
Create a Home Valuation Report for This Property
The Home Valuation Report is an in-depth analysis detailing your home's value as well as a comparison with similar homes in the area
Home Values in the Area
Average Home Value in this Area
Purchase History
| Date | Buyer | Sale Price | Title Company |
|---|---|---|---|
| Morin Kathy Pillow | -- | Stewart Title | |
| Wilson Britt Pamela J | -- | Stewart Title Of Montgomery | |
| Jernigan Kari | -- | Priority Title Co |
Source: Public Records
Mortgage History
| Date | Status | Borrower | Loan Amount |
|---|---|---|---|
| Open | Morin Kathy Pillow | $188,000 | |
| Previous Owner | Wilson Britt Pamela J | $160,047 | |
| Previous Owner | Jernigan Kari | $143,250 |
Source: Public Records
Tax History Compared to Growth
Tax History
| Year | Tax Paid | Tax Assessment Tax Assessment Total Assessment is a certain percentage of the fair market value that is determined by local assessors to be the total taxable value of land and additions on the property. | Land | Improvement |
|---|---|---|---|---|
| 2025 | $2,437 | $335,507 | $62,111 | $273,396 |
| 2024 | $2,437 | $338,968 | $62,111 | $276,857 |
| 2023 | $2,437 | $348,314 | $62,111 | $286,203 |
| 2022 | $6,070 | $295,454 | $54,804 | $240,650 |
| 2021 | $5,901 | $216,037 | $39,824 | $176,213 |
| 2020 | $6,262 | $216,037 | $39,824 | $176,213 |
| 2019 | $6,515 | $216,558 | $39,824 | $176,734 |
| 2018 | $2,428 | $218,102 | $39,824 | $178,278 |
| 2017 | $6,615 | $218,102 | $39,824 | $178,278 |
| 2016 | $6,615 | $218,102 | $39,824 | $178,278 |
| 2015 | $5,730 | $204,824 | $39,824 | $165,000 |
| 2014 | $5,730 | $183,886 | $39,824 | $144,062 |
Source: Public Records
Map
Nearby Homes
- 20014 Alcea Ct
- 9427 Thurber Ridge Dr
- 9431 Thurber Ridge Dr
- 19814 Ringwald Ct
- 9535 Empress Crossing Dr
- 9107 Fernwillow Dr
- 19803 Sternwood Manor Dr
- 9619 Brackenton Crest Dr
- 19718 Oxalis Ct
- 20008 Champion Forest Dr Unit 1001
- 9935 Kirkstone Terrace Dr
- 7 Compton Manor Dr
- 19902 Tidy Tips Ln
- 10007 Elderberry Park Ln
- 10222 Berrypatch Ln
- 20314 Dark Hollow Ln
- 20931 Sweet Blossom Ln
- 19518 Remington Manor St
- 21102 Sweet River Ln
- 19514 Juniper Breeze Ln
- 20106 Gunters Ridge Dr
- 20114 Gunters Ridge Dr
- 20102 Gunters Ridge Dr
- 9230 Night Beacon Point Dr
- 20111 Gunters Ridge Dr
- 20122 Gunters Ridge Dr
- 9226 Night Beacon Point Dr
- 20107 Gunters Ridge Dr
- 20103 Gunters Ridge Dr
- 20115 Gunters Ridge Dr
- 20022 Gunters Ridge Dr
- 9222 Night Beacon Point Dr
- 20126 Gunters Ridge Dr
- 20019 Alcea Ct
- 20119 Gunters Ridge Dr
- 9218 Night Beacon Point Dr
- 20118 Gunters Ridge Dr
- 20118 Gunters Ridge Dr
- 20031 Gunters Ridge Dr
- 20015 Alcea Ct