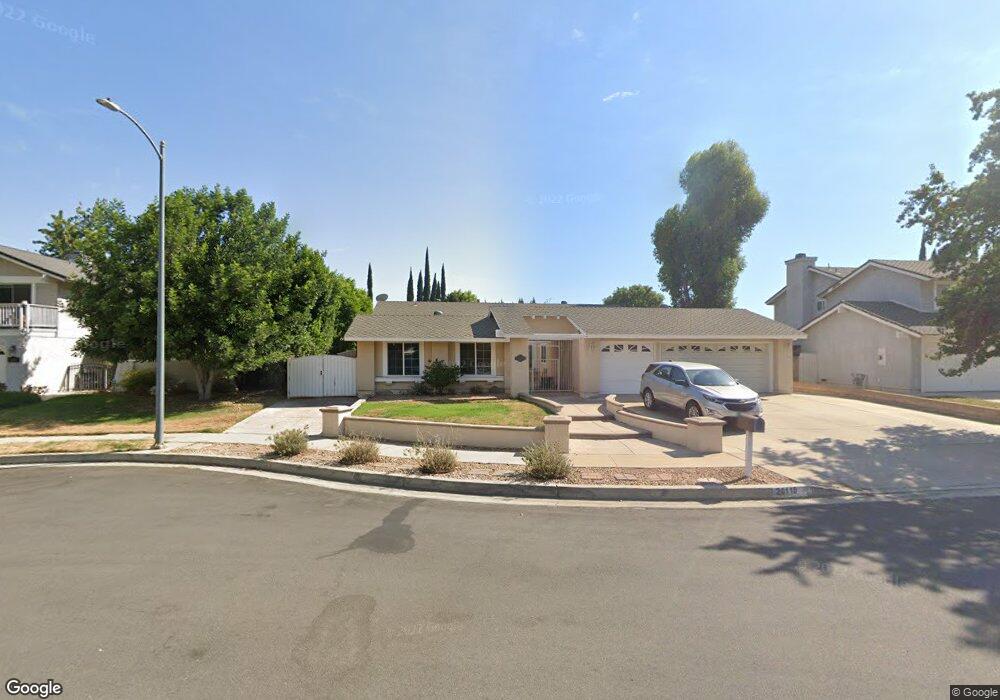
20110 Lemarsh St Chatsworth, CA 91311
Estimated Value: $951,000 - $1,075,000
4
Beds
2
Baths
2,018
Sq Ft
$503/Sq Ft
Est. Value
About This Home
This home is located at 20110 Lemarsh St, Chatsworth, CA 91311 and is currently estimated at $1,015,076, approximately $503 per square foot. 20110 Lemarsh St is a home located in Los Angeles County with nearby schools including Ernest Lawrence Middle School, Superior Street Elementary School, and Our Community School.
Ownership History
Date
Name
Owned For
Owner Type
Purchase Details
Closed on
Jul 17, 2025
Sold by
Marsha Hicks Minassian Trust and Marsha Hicks Minassian Living Trust
Bought by
Marsha Hicks Minassian Living Trust and Minassian
Current Estimated Value
Home Financials for this Owner
Home Financials are based on the most recent Mortgage that was taken out on this home.
Original Mortgage
$1,500,000
Outstanding Balance
$1,498,706
Interest Rate
6.74%
Mortgage Type
Reverse Mortgage Home Equity Conversion Mortgage
Estimated Equity
-$483,630
Purchase Details
Closed on
Mar 5, 2019
Sold by
Minassian Marsha
Bought by
Minassian Marsha Hicks and The Marsha Hicks Minassian Tru
Purchase Details
Closed on
Sep 2, 2009
Sold by
Minassian Vazgen
Bought by
Minassian Marsha
Create a Home Valuation Report for This Property
The Home Valuation Report is an in-depth analysis detailing your home's value as well as a comparison with similar homes in the area
Home Values in the Area
Average Home Value in this Area
Purchase History
| Date | Buyer | Sale Price | Title Company |
|---|---|---|---|
| Marsha Hicks Minassian Living Trust | -- | Placer Title Company | |
| Minassian Marsha Hicks | -- | None Available | |
| Minassian Marsha | -- | None Available |
Source: Public Records
Mortgage History
| Date | Status | Borrower | Loan Amount |
|---|---|---|---|
| Open | Marsha Hicks Minassian Living Trust | $1,500,000 | |
| Previous Owner | Marsha Hicks Minassian Living Trust | $1,500,000 |
Source: Public Records
Tax History
| Year | Tax Paid | Tax Assessment Tax Assessment Total Assessment is a certain percentage of the fair market value that is determined by local assessors to be the total taxable value of land and additions on the property. | Land | Improvement |
|---|---|---|---|---|
| 2025 | $2,960 | $206,591 | $39,319 | $167,272 |
| 2024 | $2,960 | $202,542 | $38,549 | $163,993 |
| 2023 | $2,912 | $198,572 | $37,794 | $160,778 |
| 2022 | $2,792 | $194,679 | $37,053 | $157,626 |
| 2021 | $2,751 | $190,863 | $36,327 | $154,536 |
| 2019 | $2,679 | $185,203 | $35,250 | $149,953 |
| 2018 | $2,496 | $181,572 | $34,559 | $147,013 |
| 2016 | $2,370 | $174,523 | $33,218 | $141,305 |
| 2015 | $2,339 | $171,903 | $32,720 | $139,183 |
| 2014 | $2,358 | $168,537 | $32,080 | $136,457 |
Source: Public Records
Map
Nearby Homes
- 10122 Jovita Ave
- 10211 Casaba Ave
- 20118 Lassen St
- 20200 Lassen St
- 19914 Vintage St
- 10345 Oso Ave
- 10020 Mason Ave
- 10201 Mason Ave Unit 19
- 20323 Kinzie St
- 19865 Hiawatha St
- 10037 Sunnybrae Ave
- 9800 Kessler Ave
- 10565 Lubao Ave
- 9710 Lubao Ave
- 20604 Lemmer St
- 20431 Germain St
- 9916 Bothwell Rd
- 20500 Blairmoore St
- 9847 Bothwell Rd
- 10658 Fullbright Ave
- 20118 Lemarsh St
- 20102 Lemarsh St
- 20117 Romar St
- 20128 Lemarsh St
- 20123 Romar St
- 20113 Lemarsh St
- 20105 Lemarsh St
- 20134 Lemarsh St
- 20121 Lemarsh St
- 20100 Romar St
- 20131 Romar St
- 20058 Lemarsh St
- 20059 Lemarsh St
- 20131 Lemarsh St
- 20140 Lemarsh St
- 20116 Tuba St
- 20059 Romar St
- 20137 Romar St
- 20110 Tuba St
- 20114 Romar St
Your Personal Tour Guide
Ask me questions while you tour the home.