20112 Arminta St Winnetka, CA 91306
Estimated Value: $868,000 - $1,039,000
About This Home
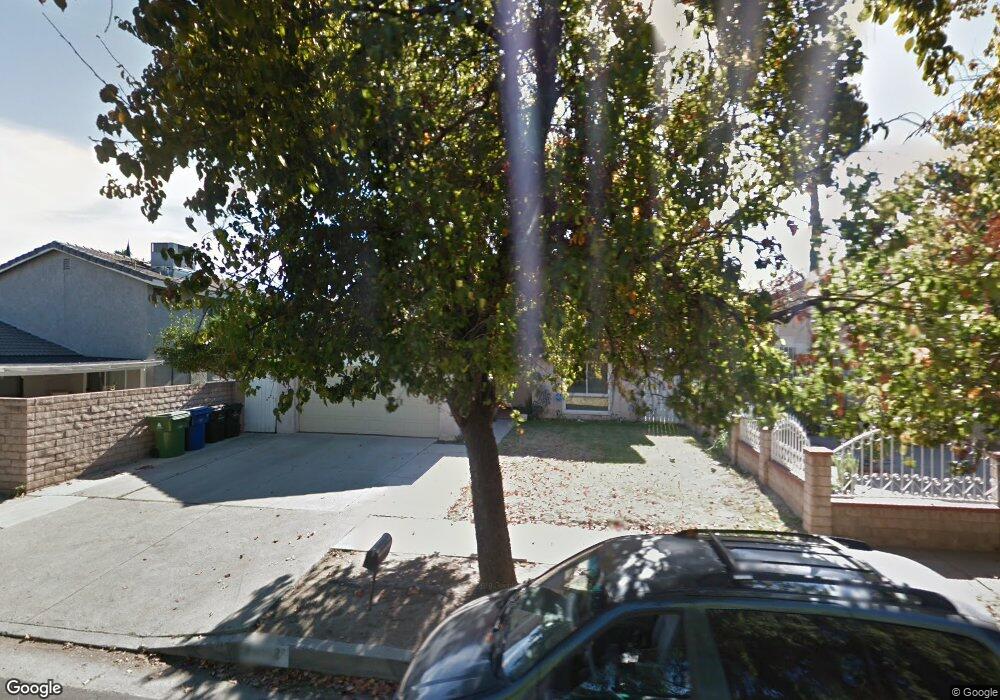
This home is located at 20112 Arminta St, Winnetka, CA 91306 and is currently estimated at $951,522, approximately $467 per square foot. 20112 Arminta St is a home located in Los Angeles County with nearby schools including Winnetka Avenue Elementary School, John A. Sutter Middle School, and Northridge Academy High.
Ownership History
We collect this data history from publicly available records. To have your information removed, we recommend requesting removal directly through your county’s website.
Purchase Details
Home Financials for this Owner
Home Financials are based on the most recent Mortgage that was taken out on this home.Purchase Details
Home Financials for this Owner
Home Financials are based on the most recent Mortgage that was taken out on this home.Purchase Details
Home Financials for this Owner
Home Financials are based on the most recent Mortgage that was taken out on this home.Home Values in the Area
Average Home Value in this Area
Purchase History
We collect this data history from publicly available records. To have your information removed, we recommend requesting removal directly through your county’s website.
| Date | Buyer | Sale Price | Title Company |
|---|---|---|---|
| -- | Wfg National Title Company | ||
| $515,000 | Wfg National Title Company | ||
| -- | Commerce Title |
Mortgage History
We collect this data history from publicly available records. To have your information removed, we recommend requesting removal directly through your county’s website.
| Date | Status | Borrower | Loan Amount |
|---|---|---|---|
| Open | $386,250 | ||
| Previous Owner | $222,300 |
Tax History
We collect this data history from publicly available records. To have your information removed, we recommend requesting removal directly through your county’s website.
| Year | Tax Paid | Tax Assessment Tax Assessment Total Assessment is a certain percentage of the fair market value that is determined by local assessors to be the total taxable value of land and additions on the property. | Land | Improvement |
|---|---|---|---|---|
| 2025 | $8,463 | $680,416 | $373,205 | $307,211 |
| 2024 | $8,389 | $667,076 | $365,888 | $301,188 |
| 2023 | $8,230 | $653,997 | $358,714 | $295,283 |
| 2022 | $7,853 | $641,175 | $351,681 | $289,494 |
| 2021 | $7,752 | $628,604 | $344,786 | $283,818 |
| 2019 | $7,523 | $609,960 | $334,560 | $275,400 |
| 2018 | $3,223 | $248,118 | $59,305 | $188,813 |
| 2016 | $3,064 | $238,485 | $57,003 | $181,482 |
| 2015 | $3,022 | $234,903 | $56,147 | $178,756 |
| 2014 | $3,040 | $230,303 | $55,048 | $175,255 |
Map
- 7867 Laramie Ave
- 20155 Keswick St Unit 209
- 20027 Blythe St
- 20235 Keswick St Unit 212
- 20819 W Seasons Ln
- 20253 Keswick St Unit 325
- 20230 Keswick St Unit 3
- 20329 Stagg St
- 7640 Oso Ave Unit 318
- 7640 Oso Ave Unit 316
- 20221 Baltar St
- 20226 Lanark St
- 7754 Delco Ave
- 8023 Oakdale Ave
- 20439 Hemmingway St
- 7515 Winnetka Ave Unit 108
- 20214 Cohasset St Unit 16
- 20234 Cohasset St Unit 7
- 20146 Cohasset St Unit 11
- 20454 Strathern St
- 20121 Elkwood St
- 20117 Elkwood St
- 7806 Comanche Ave
- 7800 Comanche Ave
- 20111 Elkwood St
- 7812 Comanche Ave
- 20120 Arminta St
- 20116 Arminta St
- 7818 Comanche Ave
- 20122 Elkwood St
- 7811 Winnetka Ave
- 20118 Elkwood St
- 20105 Elkwood St
- 7822 Comanche Ave
- 20128 Elkwood St
- 7817 Winnetka Ave
- 20112 Elkwood St
- 20132 Elkwood St
- 7803 Winnetka Ave
- 7823 Winnetka Ave
Ask me questions while you tour the home.