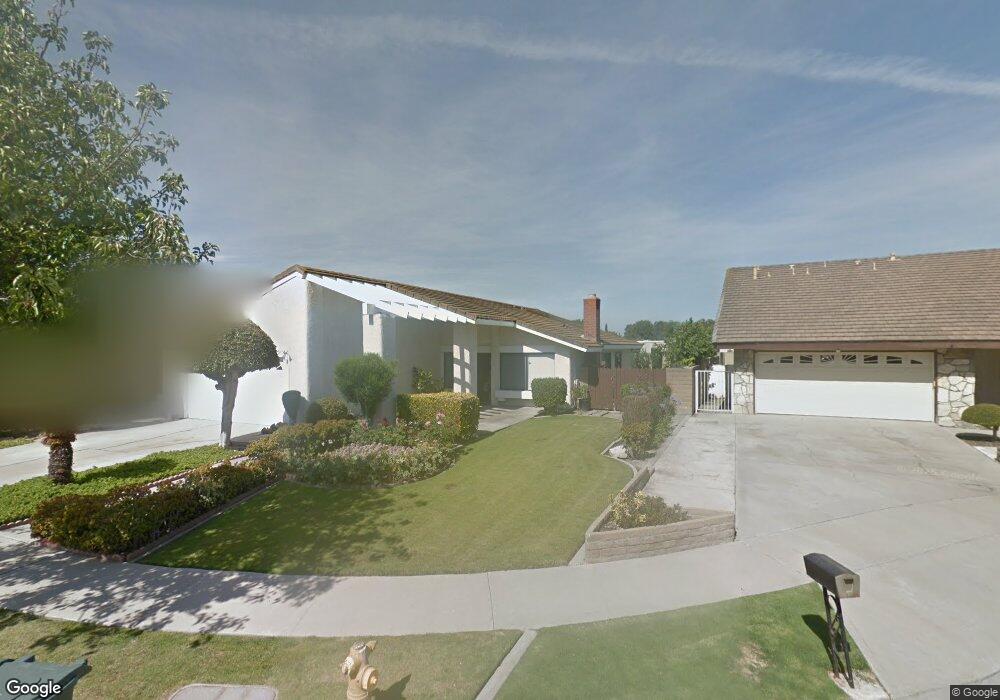
20117 Plaza de Cordoba Cerritos, CA 90703
Estimated Value: $976,591 - $1,129,000
3
Beds
2
Baths
1,451
Sq Ft
$726/Sq Ft
Est. Value
About This Home
This home is located at 20117 Plaza de Cordoba, Cerritos, CA 90703 and is currently estimated at $1,053,648, approximately $726 per square foot. 20117 Plaza de Cordoba is a home located in Los Angeles County with nearby schools including Nixon Academy, Haskell Stem Academy, and Artesia High School.
Ownership History
Date
Name
Owned For
Owner Type
Purchase Details
Closed on
Oct 4, 2016
Sold by
Tai Chunni
Bought by
Calimquim Daniel and Callmquim Maria E
Current Estimated Value
Home Financials for this Owner
Home Financials are based on the most recent Mortgage that was taken out on this home.
Original Mortgage
$417,000
Outstanding Balance
$334,091
Interest Rate
3.44%
Mortgage Type
New Conventional
Estimated Equity
$719,557
Purchase Details
Closed on
Jul 4, 2013
Sold by
Tai Chunni and Tai Cheng Nan
Bought by
Tai Chunni
Home Financials for this Owner
Home Financials are based on the most recent Mortgage that was taken out on this home.
Original Mortgage
$329,950
Interest Rate
4.28%
Mortgage Type
New Conventional
Purchase Details
Closed on
Jul 26, 2000
Sold by
Tai Cheng Nan and Tai L Shall Don
Bought by
Tai Chunni and Tai Cheng Nan
Create a Home Valuation Report for This Property
The Home Valuation Report is an in-depth analysis detailing your home's value as well as a comparison with similar homes in the area
Home Values in the Area
Average Home Value in this Area
Purchase History
| Date | Buyer | Sale Price | Title Company |
|---|---|---|---|
| Calimquim Daniel | $579,000 | Western Resources Title | |
| Tai Chunni | -- | Western Resources Title | |
| Tai Chunni | -- | None Available | |
| Tai Chunni | -- | None Available | |
| Tai Chunni | -- | -- |
Source: Public Records
Mortgage History
| Date | Status | Borrower | Loan Amount |
|---|---|---|---|
| Open | Calimquim Daniel | $417,000 | |
| Previous Owner | Tai Chunni | $329,950 |
Source: Public Records
Tax History Compared to Growth
Tax History
| Year | Tax Paid | Tax Assessment Tax Assessment Total Assessment is a certain percentage of the fair market value that is determined by local assessors to be the total taxable value of land and additions on the property. | Land | Improvement |
|---|---|---|---|---|
| 2025 | $8,026 | $671,973 | $537,580 | $134,393 |
| 2024 | $8,026 | $658,798 | $527,040 | $131,758 |
| 2023 | $7,763 | $645,881 | $516,706 | $129,175 |
| 2022 | $7,647 | $633,218 | $506,575 | $126,643 |
| 2021 | $7,469 | $620,803 | $496,643 | $124,160 |
| 2019 | $7,298 | $602,391 | $481,913 | $120,478 |
| 2018 | $6,755 | $590,580 | $472,464 | $118,116 |
| 2016 | $6,065 | $528,121 | $372,791 | $155,330 |
| 2015 | $5,989 | $520,189 | $367,192 | $152,997 |
| 2014 | $5,869 | $510,000 | $360,000 | $150,000 |
Source: Public Records
Map
Nearby Homes
- 19528 Ray Cir
- 19518 Nancy Cir
- 11702 Gloria Ct
- 11974 Bos St
- 11932 207th St
- 11750 206th St Unit 7
- 20841 Horst Ave
- 19731 Sally Ave
- 19657 Sequoia Ave
- 12132 Cambrian Cir
- 12141 Centralia St Unit 119
- 19127 Pioneer Blvd Unit 30
- 19127 Pioneer Blvd Unit 9
- 19127 Pioneer Blvd Unit SPC 23
- 19127 Pioneer Blvd Unit 27
- 11609 208th St
- 11518 205th St
- 20822 Roseton Ave
- 20833 Verne Ave
- 12308 Centralia St
- 20123 Plaza de Cordoba
- 20113 Plaza de Cordoba
- 20129 Plaza de Cordoba
- 20105 Plaza de Cordoba
- 20142 Plaza de Cordoba
- 20101 Plaza de Cordoba
- 20114 Plaza de Cordoba
- 20133 Plaza de Cordoba
- 20110 Plaza de Cordoba
- 20148 Plaza de Cordoba
- 20106 Plaza de Cordoba
- 20137 Plaza de Cordoba
- 11962 Eberle St
- 11958 Eberle St
- 11968 Eberle St
- 20143 Plaza de Cordoba
- 11954 Eberle St
- 11974 Eberle St
- 11948 Eberle St
- 20149 Plaza de Cordoba