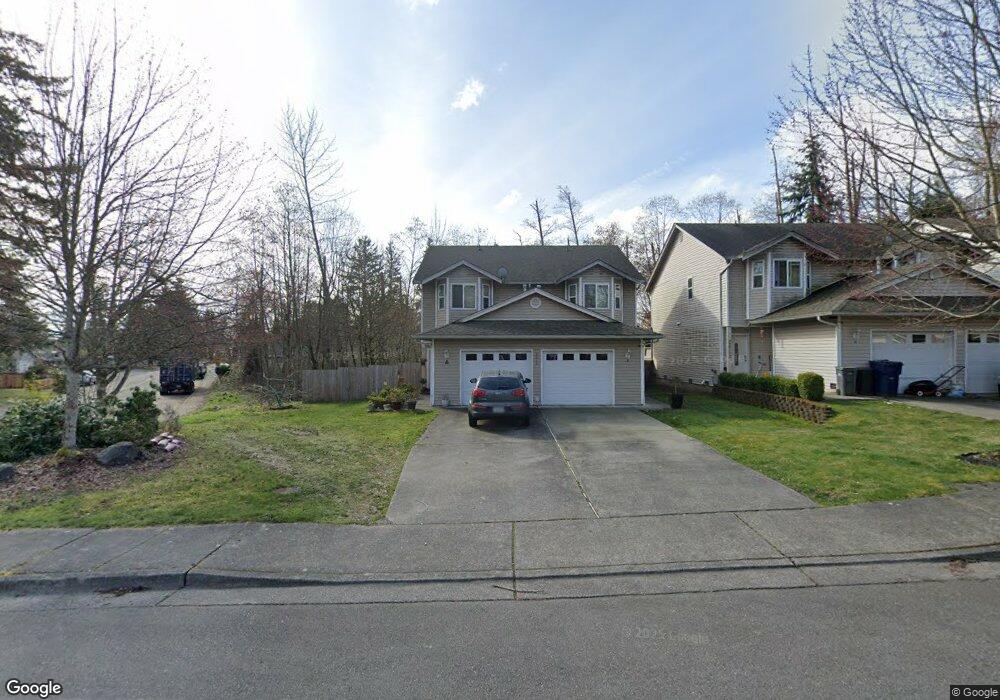
2012 104th St SW Unit A Everett, WA 98204
Holly NeighborhoodEstimated Value: $426,519 - $541,000
3
Beds
3
Baths
1,167
Sq Ft
$412/Sq Ft
Est. Value
About This Home
This home is located at 2012 104th St SW Unit A, Everett, WA 98204 and is currently estimated at $481,130, approximately $412 per square foot. 2012 104th St SW Unit A is a home located in Snohomish County with nearby schools including Challenger Elementary School, Fairmount Elementary School, and Explorer Middle School.
Ownership History
Date
Name
Owned For
Owner Type
Purchase Details
Closed on
Jun 15, 2011
Sold by
Ngk Investments Llc
Bought by
Trussell Cheryl A and Trussell Christopher R
Current Estimated Value
Home Financials for this Owner
Home Financials are based on the most recent Mortgage that was taken out on this home.
Original Mortgage
$6,128
Interest Rate
4.56%
Mortgage Type
Unknown
Purchase Details
Closed on
Jul 9, 2010
Sold by
Brothers Tina
Bought by
Ngk Investments Llc
Purchase Details
Closed on
Jul 21, 2006
Sold by
Landreth Roy B
Bought by
Brothers Tina
Home Financials for this Owner
Home Financials are based on the most recent Mortgage that was taken out on this home.
Original Mortgage
$47,500
Interest Rate
6.57%
Mortgage Type
Stand Alone Second
Purchase Details
Closed on
Mar 4, 2004
Sold by
Rosewood Park Development Llc
Bought by
Landreth Roy B
Home Financials for this Owner
Home Financials are based on the most recent Mortgage that was taken out on this home.
Original Mortgage
$174,444
Interest Rate
5.65%
Mortgage Type
FHA
Create a Home Valuation Report for This Property
The Home Valuation Report is an in-depth analysis detailing your home's value as well as a comparison with similar homes in the area
Home Values in the Area
Average Home Value in this Area
Purchase History
| Date | Buyer | Sale Price | Title Company |
|---|---|---|---|
| Trussell Cheryl A | $170,000 | Old Republic Title Ltd | |
| Ngk Investments Llc | $137,041 | Accommodation | |
| Brothers Tina | $237,500 | Transnation Title | |
| Landreth Roy B | $179,840 | First American |
Source: Public Records
Mortgage History
| Date | Status | Borrower | Loan Amount |
|---|---|---|---|
| Closed | Trussell Cheryl A | $6,128 | |
| Open | Trussell Cheryl A | $165,690 | |
| Previous Owner | Brothers Tina | $47,500 | |
| Previous Owner | Brothers Tina | $190,000 | |
| Previous Owner | Landreth Roy B | $174,444 |
Source: Public Records
Tax History
| Year | Tax Paid | Tax Assessment Tax Assessment Total Assessment is a certain percentage of the fair market value that is determined by local assessors to be the total taxable value of land and additions on the property. | Land | Improvement |
|---|---|---|---|---|
| 2026 | $3,425 | $450,000 | $90,000 | $360,000 |
| 2025 | $3,181 | $436,500 | $86,000 | $350,500 |
| 2024 | $3,181 | $410,000 | $82,000 | $328,000 |
| 2023 | $2,950 | $390,000 | $79,000 | $311,000 |
| 2022 | $2,994 | $343,000 | $63,000 | $280,000 |
| 2020 | $2,606 | $300,000 | $60,000 | $240,000 |
| 2019 | $2,222 | $259,000 | $49,000 | $210,000 |
| 2018 | $2,152 | $216,000 | $41,000 | $175,000 |
| 2017 | $1,909 | $196,000 | $38,500 | $157,500 |
| 2016 | $1,750 | $178,000 | $36,500 | $141,500 |
| 2015 | $1,731 | $159,000 | $36,500 | $122,500 |
| 2013 | $1,602 | $137,000 | $36,500 | $100,500 |
Source: Public Records
Map
Nearby Homes
- 1908 98th Place SW Unit B
- 10425 Holly Dr
- 1518 Hollow Dale Place Unit E
- 1520 Hollow Dale Place Unit E
- 1520 Hollow Dale Place Unit F
- 1520 Hollow Dale Place Unit G
- 1807 112th St SW
- 1427 100th St SW Unit 75
- 1427 100th St SW Unit 160
- 1427 100th St SW Unit 57
- 1427 100th St SW Unit 149
- 1427 100th St SW Unit 27
- 1427 100th St SW Unit 145
- 1427 100th St SW Unit 154
- 1427 100th St SW Unit 127
- 1427 100th St SW Unit 67
- 2006 112th St SW
- 9330 16th Dr W Unit 22
- 1626 93rd Place SW Unit 25
- 10000 23rd Ave W
- 2024 104th St SW Unit B
- 2024 104th St SW Unit A
- 2012 104th St SW Unit B
- 2016 104th St SW Unit B
- 2016 104th St SW Unit A
- 2020 104th St SW Unit B
- 2020 104th St SW Unit A
- 2032 104th St SW Unit 2032
- 2028 104th St SW
- 2015 104th St SW
- 2011 104th St SW
- 2025 104th St SW Unit A & B
- 2025 104th St SW
- 2007 104th St SW
- 2003 104th St SW
- 10422 Rosewood Ave
- 10424 Rosewood Ave
- 10420 Rosewood Ave
- 10420 Rosewood Ave Unit 5
- 10426 Rosewood Ave
Your Personal Tour Guide
Ask me questions while you tour the home.