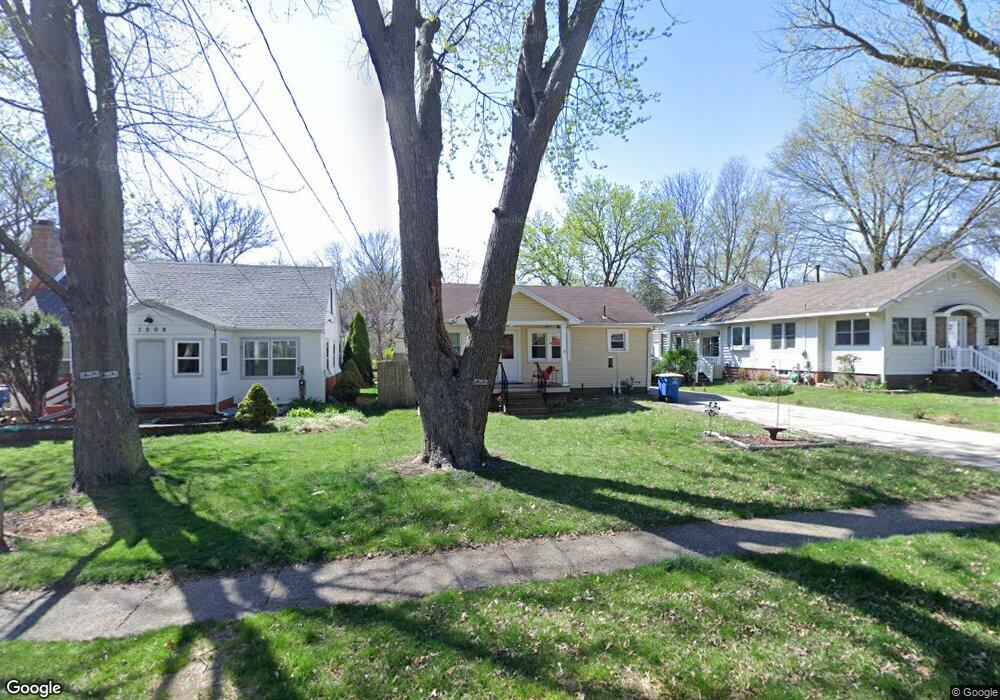
2012 37th St Des Moines, IA 50310
Beaverdale NeighborhoodEstimated Value: $181,000 - $204,000
2
Beds
1
Bath
726
Sq Ft
$269/Sq Ft
Est. Value
About This Home
This home is located at 2012 37th St, Des Moines, IA 50310 and is currently estimated at $195,170, approximately $268 per square foot. 2012 37th St is a home located in Polk County with nearby schools including Monroe Elementary School, Meredith Middle School, and Hoover High School.
Ownership History
Date
Name
Owned For
Owner Type
Purchase Details
Closed on
Nov 17, 2016
Sold by
Evans Marti
Bought by
Evans Marti and Evans Jessica
Current Estimated Value
Purchase Details
Closed on
Jul 8, 2009
Sold by
Spevak Michael F
Bought by
Evans Marti R
Home Financials for this Owner
Home Financials are based on the most recent Mortgage that was taken out on this home.
Original Mortgage
$92,720
Outstanding Balance
$59,117
Interest Rate
4.94%
Mortgage Type
Purchase Money Mortgage
Estimated Equity
$136,053
Create a Home Valuation Report for This Property
The Home Valuation Report is an in-depth analysis detailing your home's value as well as a comparison with similar homes in the area
Home Values in the Area
Average Home Value in this Area
Purchase History
| Date | Buyer | Sale Price | Title Company |
|---|---|---|---|
| Evans Marti | -- | None Available | |
| Evans Marti R | $115,500 | None Available |
Source: Public Records
Mortgage History
| Date | Status | Borrower | Loan Amount |
|---|---|---|---|
| Open | Evans Marti R | $92,720 |
Source: Public Records
Tax History
| Year | Tax Paid | Tax Assessment Tax Assessment Total Assessment is a certain percentage of the fair market value that is determined by local assessors to be the total taxable value of land and additions on the property. | Land | Improvement |
|---|---|---|---|---|
| 2025 | $2,992 | $180,400 | $45,600 | $134,800 |
| 2024 | $2,992 | $162,600 | $41,000 | $121,600 |
| 2023 | $3,030 | $162,600 | $41,000 | $121,600 |
| 2022 | $3,004 | $137,400 | $36,200 | $101,200 |
| 2021 | $2,912 | $137,400 | $36,200 | $101,200 |
| 2020 | $3,020 | $125,300 | $33,100 | $92,200 |
| 2019 | $2,810 | $125,300 | $33,100 | $92,200 |
| 2018 | $2,776 | $113,100 | $29,500 | $83,600 |
| 2017 | $2,452 | $113,100 | $29,500 | $83,600 |
| 2016 | $2,384 | $99,200 | $25,800 | $73,400 |
| 2015 | $2,384 | $99,200 | $25,800 | $73,400 |
| 2014 | $2,252 | $96,900 | $25,000 | $71,900 |
Source: Public Records
Map
Nearby Homes
Your Personal Tour Guide
Ask me questions while you tour the home.