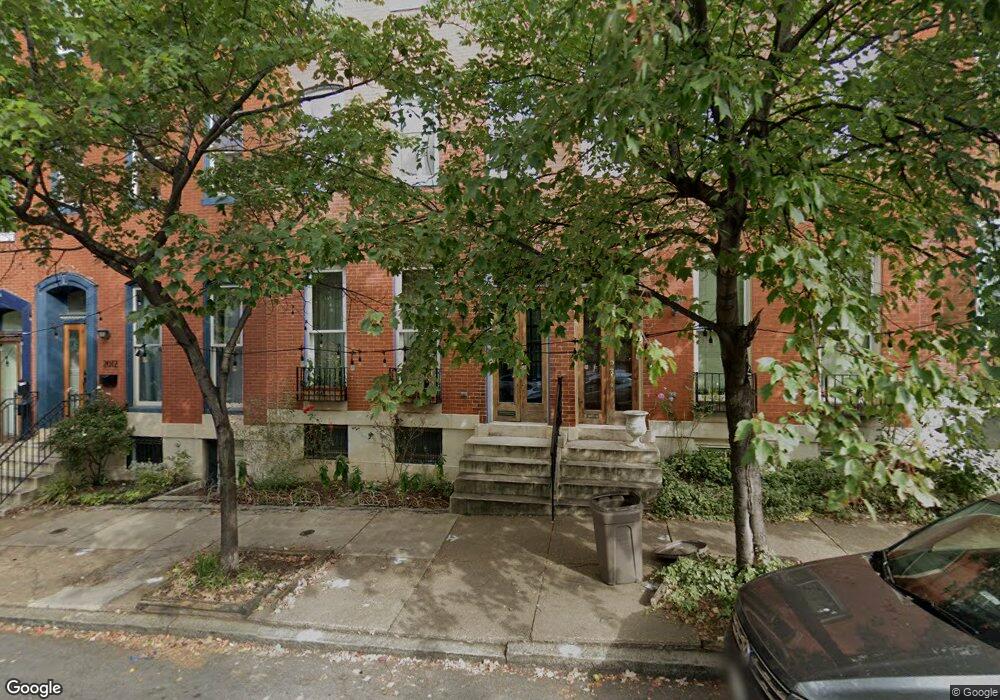
2012 E Baltimore St Baltimore, MD 21231
Butchers Hill NeighborhoodEstimated Value: $456,104 - $673,000
Studio
3
Baths
2,848
Sq Ft
$198/Sq Ft
Est. Value
About This Home
This home is located at 2012 E Baltimore St, Baltimore, MD 21231 and is currently estimated at $564,552, approximately $198 per square foot. 2012 E Baltimore St is a home located in Baltimore City with nearby schools including Commodore John Rogers Elementary School, Booker T. Washington Middle School, and Paul Laurence Dunbar High School.
Ownership History
Date
Name
Owned For
Owner Type
Purchase Details
Closed on
Oct 27, 2011
Sold by
S Goldberg Properties Llc
Bought by
Plovan Bradley C and Feldman Faye S
Current Estimated Value
Home Financials for this Owner
Home Financials are based on the most recent Mortgage that was taken out on this home.
Original Mortgage
$315,500
Outstanding Balance
$210,942
Interest Rate
3.62%
Mortgage Type
New Conventional
Estimated Equity
$353,610
Purchase Details
Closed on
Jan 4, 2005
Sold by
Plovan Bradley C
Bought by
Plovan Bradley C and Feldman Faye S
Purchase Details
Closed on
Feb 6, 2001
Sold by
Chapel Street Llc
Bought by
Plovan Bradley C
Purchase Details
Closed on
Oct 6, 2000
Sold by
Shelton Timothy J
Bought by
Chapel Street Llc
Purchase Details
Closed on
May 12, 1999
Sold by
Neighborhood Rental
Bought by
Shelton Timothy J
Purchase Details
Closed on
Feb 9, 1999
Sold by
Concerned Citizens For
Bought by
Neighborhood Rental and Services Of Baltimore ,
Create a Home Valuation Report for This Property
The Home Valuation Report is an in-depth analysis detailing your home's value as well as a comparison with similar homes in the area
Home Values in the Area
Average Home Value in this Area
Purchase History
| Date | Buyer | Sale Price | Title Company |
|---|---|---|---|
| Plovan Bradley C | $1,200 | None Available | |
| Plovan Bradley C | -- | -- | |
| Plovan Bradley C | $32,000 | -- | |
| Chapel Street Llc | $14,000 | -- | |
| Shelton Timothy J | $15,500 | -- | |
| Neighborhood Rental | $13,130 | -- |
Source: Public Records
Mortgage History
| Date | Status | Borrower | Loan Amount |
|---|---|---|---|
| Open | Plovan Bradley C | $315,500 |
Source: Public Records
Tax History
| Year | Tax Paid | Tax Assessment Tax Assessment Total Assessment is a certain percentage of the fair market value that is determined by local assessors to be the total taxable value of land and additions on the property. | Land | Improvement |
|---|---|---|---|---|
| 2025 | $293 | $394,700 | $80,000 | $314,700 |
| 2024 | $293 | $388,067 | -- | -- |
| 2023 | $221 | $381,433 | $0 | $0 |
| 2022 | $202 | $374,800 | $80,000 | $294,800 |
| 2021 | $8,845 | $374,800 | $80,000 | $294,800 |
| 2020 | $420 | $374,800 | $80,000 | $294,800 |
| 2019 | $450 | $401,500 | $80,000 | $321,500 |
| 2018 | $436 | $389,100 | $0 | $0 |
| 2017 | $422 | $376,700 | $0 | $0 |
| 2016 | $5,126 | $364,300 | $0 | $0 |
| 2015 | $5,126 | $364,300 | $0 | $0 |
| 2014 | $5,126 | $364,300 | $0 | $0 |
Source: Public Records
Map
Nearby Homes
- 2024 E Baltimore St
- 23 S Washington St
- 12 S Washington St
- 22 S Castle St
- 2123 E Fairmount Ave
- 1826 E Lombard St
- 126 N Duncan St
- 33 N Ann St
- 30 S Durham St
- 2206 E Baltimore St
- 1912 E Pratt St
- 2208 E Lombard St
- 129 N Collington Ave
- 106 N Madeira St
- 1742 E Lombard St
- 19 S Regester St
- 104 N Patterson Park Ave
- 2214 E Fayette St
- 211 N Collington Ave
- 1800 E Pratt St
- 2010 E Baltimore St
- 2014 E Baltimore St
- 2008 E Baltimore St
- 2018 E Baltimore St
- 2004 E Baltimore St
- 2020 E Baltimore St
- 2002 E Baltimore St
- 2022 E Baltimore St
- 5 N Washington St
- 7 N Washington St
- 2000 Baltimore #2 St E
- 2000 E Baltimore St
- 2000 E Baltimore St Unit 2
- 2000 E Baltimore St Unit 1
- 2000 E Baltimore St Unit 1
- 2000 E Baltimore St Unit 2
- 2000 E Baltimore St Unit 3
- 9 N Washington St
- 11 N Washington St
- 2024 E Baltimore St Unit 2
Your Personal Tour Guide
Ask me questions while you tour the home.