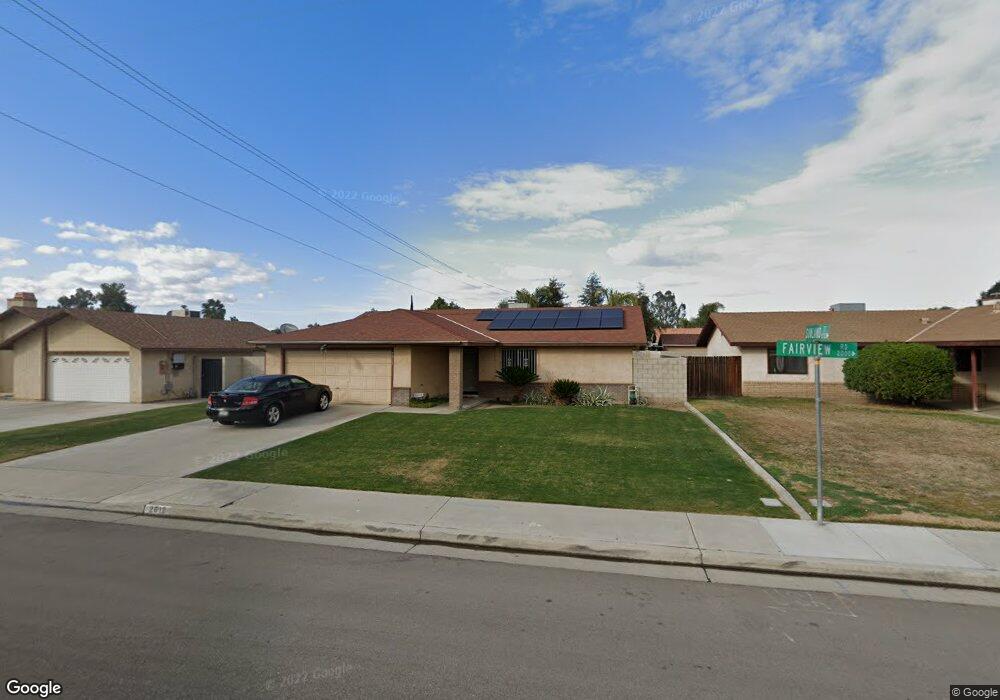
2012 Fairview Rd Bakersfield, CA 93304
South Wible Orchard NeighborhoodEstimated Value: $291,000 - $338,000
3
Beds
2
Baths
1,431
Sq Ft
$222/Sq Ft
Est. Value
About This Home
This home is located at 2012 Fairview Rd, Bakersfield, CA 93304 and is currently estimated at $317,624, approximately $221 per square foot. 2012 Fairview Rd is a home located in Kern County with nearby schools including W.A. Kendrick Elementary School, Leon H. Ollivier Middle School, and Golden Valley High School.
Ownership History
Date
Name
Owned For
Owner Type
Purchase Details
Closed on
Nov 20, 2017
Sold by
Clarke Minnie
Bought by
Clarke Minnie
Current Estimated Value
Home Financials for this Owner
Home Financials are based on the most recent Mortgage that was taken out on this home.
Original Mortgage
$156,776
Outstanding Balance
$133,134
Interest Rate
4.37%
Mortgage Type
FHA
Estimated Equity
$184,490
Purchase Details
Closed on
Mar 12, 2001
Sold by
Clarke Ralph
Bought by
Clarke Minnie
Home Financials for this Owner
Home Financials are based on the most recent Mortgage that was taken out on this home.
Original Mortgage
$78,300
Interest Rate
7.09%
Purchase Details
Closed on
Feb 23, 2001
Sold by
Stclair M Frank and Stclair Arlana Joy
Bought by
Clarke Minnie
Home Financials for this Owner
Home Financials are based on the most recent Mortgage that was taken out on this home.
Original Mortgage
$78,300
Interest Rate
7.09%
Create a Home Valuation Report for This Property
The Home Valuation Report is an in-depth analysis detailing your home's value as well as a comparison with similar homes in the area
Home Values in the Area
Average Home Value in this Area
Purchase History
| Date | Buyer | Sale Price | Title Company |
|---|---|---|---|
| Clarke Minnie | -- | Netco Title Company | |
| Clarke Minnie | -- | Stewart Title | |
| Clarke Minnie | $87,000 | Stewart Title |
Source: Public Records
Mortgage History
| Date | Status | Borrower | Loan Amount |
|---|---|---|---|
| Open | Clarke Minnie | $156,776 | |
| Previous Owner | Clarke Minnie | $78,300 |
Source: Public Records
Tax History
| Year | Tax Paid | Tax Assessment Tax Assessment Total Assessment is a certain percentage of the fair market value that is determined by local assessors to be the total taxable value of land and additions on the property. | Land | Improvement |
|---|---|---|---|---|
| 2025 | $2,170 | $131,071 | $30,125 | $100,946 |
| 2024 | $2,119 | $128,502 | $29,535 | $98,967 |
| 2023 | $2,119 | $125,983 | $28,956 | $97,027 |
| 2022 | $2,083 | $123,514 | $28,389 | $95,125 |
| 2021 | $1,966 | $121,093 | $27,833 | $93,260 |
| 2020 | $1,911 | $119,852 | $27,548 | $92,304 |
| 2019 | $1,879 | $119,852 | $27,548 | $92,304 |
| 2018 | $1,801 | $115,200 | $26,479 | $88,721 |
| 2017 | $1,782 | $112,942 | $25,960 | $86,982 |
| 2016 | $1,680 | $110,728 | $25,451 | $85,277 |
| 2015 | $1,653 | $109,066 | $25,069 | $83,997 |
| 2014 | $1,624 | $106,930 | $24,578 | $82,352 |
Source: Public Records
Map
Nearby Homes
- 1904 Fairview Rd
- 2213 Faith Ave
- 1900 Faxon Ave
- 2500 Mandeline Ave
- 2017 William F Halsey Ave
- 5320 Jonah St
- 5900 Camp St
- 5804 Chandler Way
- 5217 Stancliff St
- 6204 Dennen St
- 0 Pacheco Rd
- 2005 Kelso Peak Ave
- 1304 Canyon Ct
- 5712 Midas St
- 1304 Santiago Ct
- 2604 Connie Ave
- 2204 Kelso Peak Ave
- 5825 Lenz Ct
- 2617 Earlene Ave
- 1328 Malerbi Ct
- 2008 Fairview Rd
- 2060 Fairview Rd
- 2013 Springfield Ave
- 2004 Fairview Rd
- 2009 Springfield Ave
- 2101 Springfield Ave
- 2000 Fairview Rd
- 5701 Sunland Ave
- 2100 Fairview Rd
- 5700 Sunland Ave
- 2001 Springfield Ave
- 5705 Sunland St
- 5705 Sunland Ave
- 1908 Fairview Rd
- 5704 Sunland Ave
- 5704 Sunland St
- 5700 Lisa Ct
- 2016 Springfield Ave
- 1909 Springfield Ave
- 5701 Alberta St
Your Personal Tour Guide
Ask me questions while you tour the home.