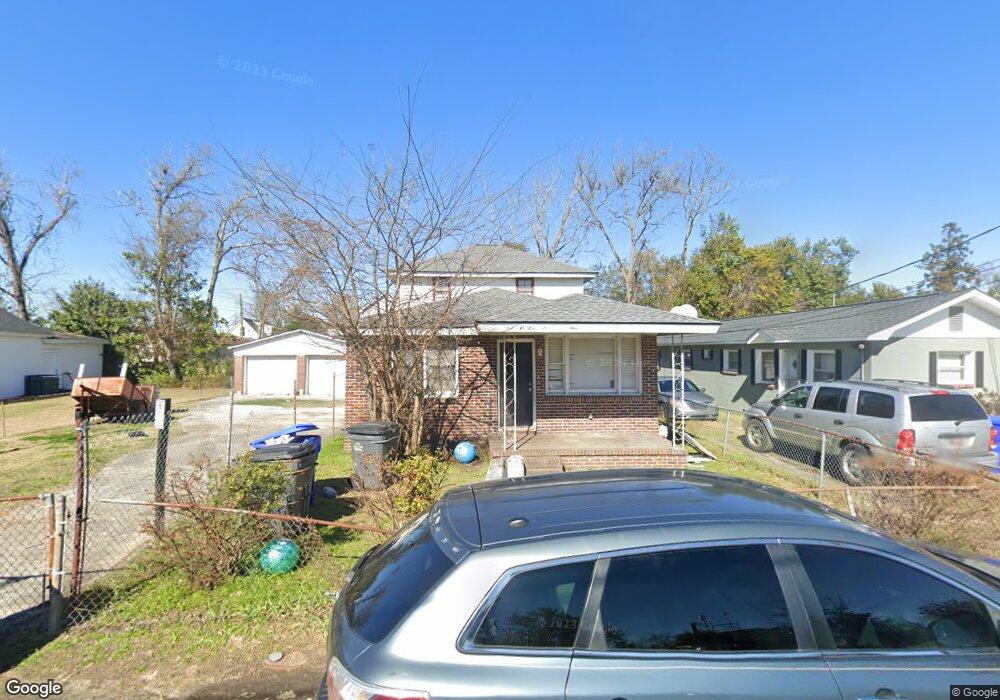
2012 Irving Ave North Charleston, SC 29405
Charleston Heights NeighborhoodEstimated Value: $179,000 - $301,000
3
Beds
1
Bath
1,536
Sq Ft
$146/Sq Ft
Est. Value
About This Home
This home is located at 2012 Irving Ave, North Charleston, SC 29405 and is currently estimated at $223,698, approximately $145 per square foot. 2012 Irving Ave is a home located in Charleston County with nearby schools including Chicora Elementary School, Mary Ford Elementary School, and Morningside Middle.
Ownership History
Date
Name
Owned For
Owner Type
Purchase Details
Closed on
Feb 4, 2013
Sold by
Nichols Scott W
Bought by
Ltd Co
Current Estimated Value
Purchase Details
Closed on
Jan 9, 2006
Sold by
Keyes Kraig S
Bought by
Nichols Scott W and Irving Avenue 2012 Land Trust
Purchase Details
Closed on
Nov 14, 2005
Sold by
Rock John
Bought by
Keyes Kraig
Purchase Details
Closed on
Dec 23, 2004
Sold by
Keyes Kraig S
Bought by
Rock John and 2012 Irving Ave Land Trust
Purchase Details
Closed on
Dec 21, 2004
Sold by
Federal National Mortgage Association
Bought by
Reyes Kraig
Purchase Details
Closed on
Oct 5, 2004
Sold by
Singleton Charlena and Countrywide Home Loans Inc
Bought by
Federal National Mortgage Association
Purchase Details
Closed on
Apr 22, 2004
Sold by
Singleton Charlena and Countrywide Homes Loans Inc
Bought by
Federal National Mortgage Association
Purchase Details
Closed on
Mar 7, 2001
Sold by
Singleton Leon
Bought by
Singleton Charlena
Create a Home Valuation Report for This Property
The Home Valuation Report is an in-depth analysis detailing your home's value as well as a comparison with similar homes in the area
Home Values in the Area
Average Home Value in this Area
Purchase History
| Date | Buyer | Sale Price | Title Company |
|---|---|---|---|
| Ltd Co | -- | -- | |
| Nichols Scott W | -- | None Available | |
| Keyes Kraig | -- | None Available | |
| Rock John | -- | -- | |
| Reyes Kraig | -- | -- | |
| Federal National Mortgage Association | $2,500 | -- | |
| Federal National Mortgage Association | $2,500 | -- | |
| Singleton Charlena | -- | -- |
Source: Public Records
Tax History Compared to Growth
Tax History
| Year | Tax Paid | Tax Assessment Tax Assessment Total Assessment is a certain percentage of the fair market value that is determined by local assessors to be the total taxable value of land and additions on the property. | Land | Improvement |
|---|---|---|---|---|
| 2024 | $1,414 | $4,100 | $0 | $0 |
| 2023 | $1,414 | $4,100 | $0 | $0 |
| 2022 | $1,305 | $4,100 | $0 | $0 |
| 2021 | $1,296 | $4,100 | $0 | $0 |
| 2020 | $1,286 | $4,100 | $0 | $0 |
| 2019 | $1,175 | $3,560 | $0 | $0 |
| 2017 | $1,097 | $3,560 | $0 | $0 |
| 2016 | $1,067 | $3,560 | $0 | $0 |
| 2015 | $1,034 | $3,560 | $0 | $0 |
| 2014 | $1,120 | $0 | $0 | $0 |
| 2011 | -- | $0 | $0 | $0 |
Source: Public Records
Map
Nearby Homes
- 1990 Irving Ave
- 1983 Hugo Ave
- 1984 Hugo Ave
- 2026 Little Ave
- 2012 Forest Ave
- 2032 Forest Ave
- 2035 Echo Ave
- 2320 Meeting Street Rd
- 1983 Echo Ave
- 2016 Echo Ave
- 2028 Echo Ave
- 2047 Delaware Ave
- 1969 Comstock Ave
- 2318 Meeting Street Rd
- 2007 Arbutus Ave
- 1912 Boxwood Ave
- 2020 Hackemann Ave
- 2007 Riverview Ave
- 2508 Corona St
- 2015 Hampton Ave Unit 1
- 2012 Irving Ave
- 2010 Irving Ave
- 2006 Irving Ave
- 2013 Hugo Ave
- 2015 Hugo Ave
- 2017 Irving Ave
- 2020 Irving Ave
- 2004 Irving Ave
- 2019 Hugo Ave
- 2021 Hugo Ave
- 2021 Irving Ave
- 2239 Cosmopolitan St
- 2000 Irving Ave
- 2023 Hugo Ave
- 2003 Hugo Ave
- 2001 Hugo Ave Unit A & B
- 2001 Hugo Ave
- 2012 Hugo Ave
- 2016 Hugo Ave
- 2026 Irving Ave