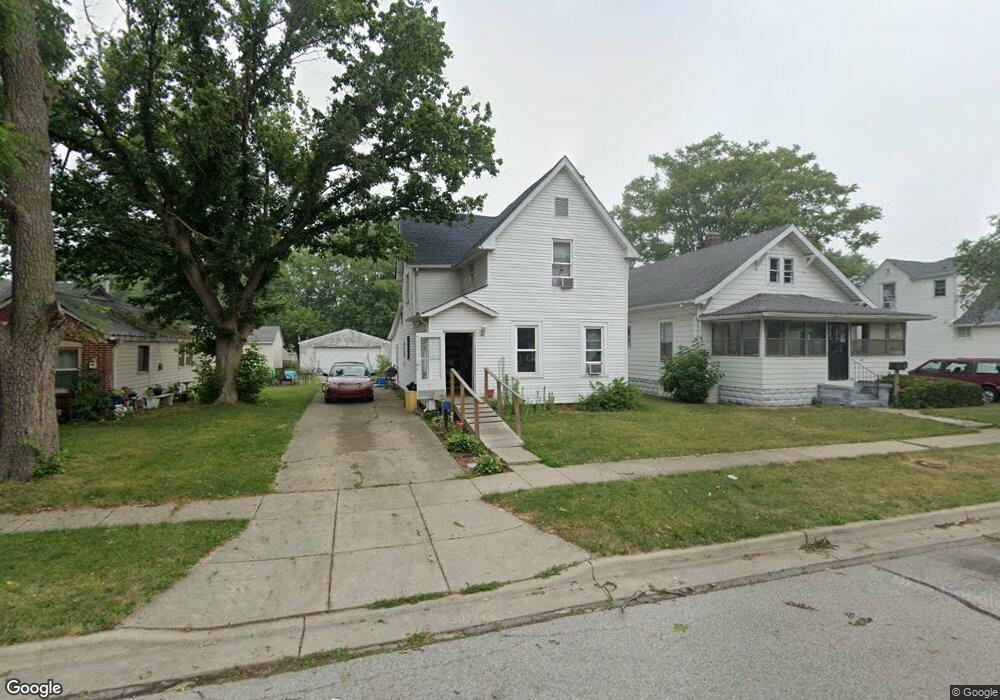
2012 Monon Ave Lafayette, IN 47904
Monon NeighborhoodEstimated Value: $168,000 - $192,269
3
Beds
1
Bath
1,440
Sq Ft
$126/Sq Ft
Est. Value
About This Home
This home is located at 2012 Monon Ave, Lafayette, IN 47904 and is currently estimated at $181,067, approximately $125 per square foot. 2012 Monon Ave is a home located in Tippecanoe County with nearby schools including Vinton Elementary School, Sunnyside Intermediate School, and Lafayette Tecumseh Junior High School.
Ownership History
Date
Name
Owned For
Owner Type
Purchase Details
Closed on
Jan 22, 2001
Sold by
Patrick Bruce A and Patrick Carol J
Bought by
Hall Michael R and Hall Jacqueline A
Current Estimated Value
Home Financials for this Owner
Home Financials are based on the most recent Mortgage that was taken out on this home.
Original Mortgage
$72,000
Outstanding Balance
$26,353
Interest Rate
7.43%
Mortgage Type
Purchase Money Mortgage
Estimated Equity
$154,714
Create a Home Valuation Report for This Property
The Home Valuation Report is an in-depth analysis detailing your home's value as well as a comparison with similar homes in the area
Home Values in the Area
Average Home Value in this Area
Purchase History
| Date | Buyer | Sale Price | Title Company |
|---|---|---|---|
| Hall Michael R | -- | -- |
Source: Public Records
Mortgage History
| Date | Status | Borrower | Loan Amount |
|---|---|---|---|
| Open | Hall Michael R | $72,000 | |
| Closed | Hall Michael R | $8,468 |
Source: Public Records
Tax History Compared to Growth
Tax History
| Year | Tax Paid | Tax Assessment Tax Assessment Total Assessment is a certain percentage of the fair market value that is determined by local assessors to be the total taxable value of land and additions on the property. | Land | Improvement |
|---|---|---|---|---|
| 2024 | $1,273 | $146,800 | $10,000 | $136,800 |
| 2023 | $1,114 | $134,800 | $10,000 | $124,800 |
| 2022 | $2,172 | $108,600 | $10,000 | $98,600 |
| 2021 | $1,766 | $88,300 | $10,000 | $78,300 |
| 2020 | $1,632 | $81,600 | $10,000 | $71,600 |
| 2019 | $1,564 | $78,200 | $10,000 | $68,200 |
| 2018 | $1,510 | $75,500 | $10,000 | $65,500 |
| 2017 | $1,486 | $74,300 | $10,000 | $64,300 |
| 2016 | $1,458 | $72,900 | $10,000 | $62,900 |
| 2014 | $1,436 | $71,800 | $10,000 | $61,800 |
| 2013 | $1,462 | $73,100 | $10,000 | $63,100 |
Source: Public Records
Map
Nearby Homes
- 2001 Schuyler Ave
- 2101 Monon Ave
- 2107 Monon Ave
- 2340 N 20th St
- 2209 Monon Ave
- 2022 Elk St
- 2215 N 18th St
- 2226 N 23rd St
- 2211 N 24th St
- 108 Barbee St
- 2127 Perrine St
- 1908 Whitcomb Ave
- 1729 Arlington Rd
- 2007 N 27th St
- 2716 Longlois Dr
- 2901 Elk St
- 1831 N 13th St
- 3013 Darby Ln
- 1925 Maple St
- 3000 Underwood St
- 2018 Monon Ave
- 2006 Monon Ave
- 2024 Monon Ave
- 2000 Monon Ave
- 2011 Stillwell St
- 2015 Stillwell St
- 2007 Stillwell St
- 2026 Monon Ave
- 2019 Stillwell St
- 2001 Stillwell St
- 2011 Monon Ave
- 2007 Monon Ave
- 2015 Monon Ave
- 2028 Monon Ave
- 2023 Stillwell St
- 2001 Monon Ave
- 2019 Monon Ave
- 2504 N 20th St
- 2023 Monon Ave
- 2027 Stillwell St