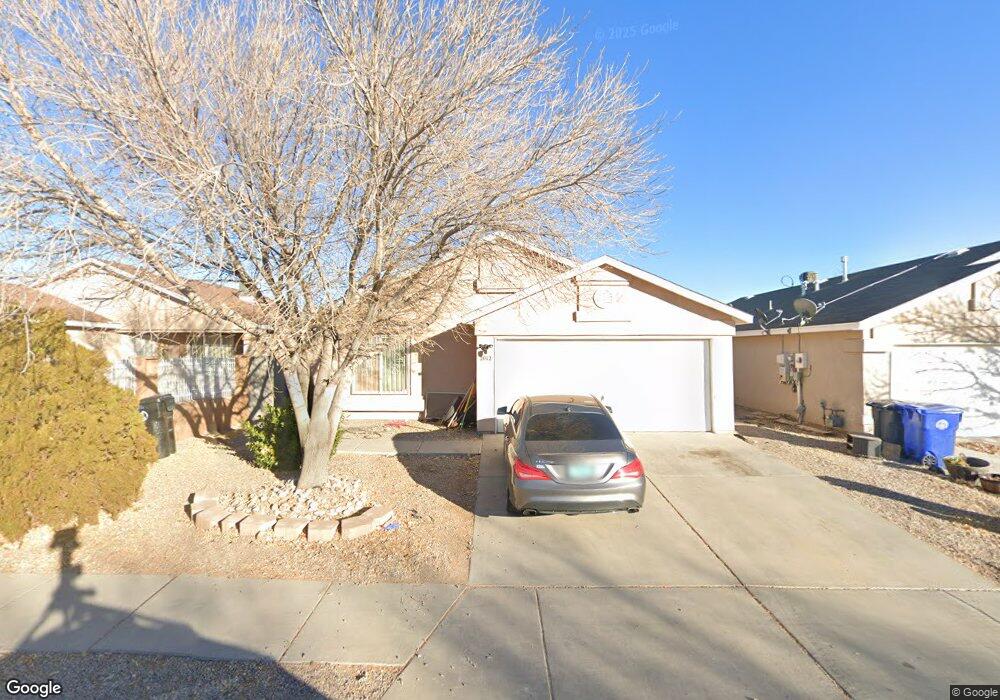
2012 N Wind Dr SW Albuquerque, NM 87121
Southwest Heights NeighborhoodEstimated Value: $222,000 - $265,000
3
Beds
2
Baths
1,026
Sq Ft
$246/Sq Ft
Est. Value
About This Home
This home is located at 2012 N Wind Dr SW, Albuquerque, NM 87121 and is currently estimated at $251,910, approximately $245 per square foot. 2012 N Wind Dr SW is a home located in Bernalillo County with nearby schools including Rudolfo Anaya Elementary School, Tony Hillerman Middle School, and Atrisco Heritage Academy High School.
Ownership History
Date
Name
Owned For
Owner Type
Purchase Details
Closed on
Jun 28, 2021
Sold by
Deherrera Angelo
Bought by
Sanchez Santana E
Current Estimated Value
Home Financials for this Owner
Home Financials are based on the most recent Mortgage that was taken out on this home.
Original Mortgage
$137,260
Outstanding Balance
$124,272
Interest Rate
2.9%
Mortgage Type
FHA
Estimated Equity
$127,638
Purchase Details
Closed on
Aug 31, 2018
Sold by
Figueroa David A and Figueroa Wilma V
Bought by
Deherrera Angelo
Home Financials for this Owner
Home Financials are based on the most recent Mortgage that was taken out on this home.
Original Mortgage
$115,000
Interest Rate
4.5%
Mortgage Type
Seller Take Back
Purchase Details
Closed on
Jan 16, 2002
Sold by
Artistic Homes Inc
Bought by
Figueroa David A and Figueroa Wilma
Create a Home Valuation Report for This Property
The Home Valuation Report is an in-depth analysis detailing your home's value as well as a comparison with similar homes in the area
Home Values in the Area
Average Home Value in this Area
Purchase History
| Date | Buyer | Sale Price | Title Company |
|---|---|---|---|
| Sanchez Santana E | -- | Fidelity National Ttl Ins Co | |
| Deherrera Angelo | $127,000 | None Available | |
| Figueroa David A | -- | -- |
Source: Public Records
Mortgage History
| Date | Status | Borrower | Loan Amount |
|---|---|---|---|
| Open | Sanchez Santana E | $137,260 | |
| Previous Owner | Deherrera Angelo | $115,000 |
Source: Public Records
Tax History Compared to Growth
Tax History
| Year | Tax Paid | Tax Assessment Tax Assessment Total Assessment is a certain percentage of the fair market value that is determined by local assessors to be the total taxable value of land and additions on the property. | Land | Improvement |
|---|---|---|---|---|
| 2025 | $2,160 | $52,737 | $16,972 | $35,765 |
| 2024 | $2,160 | $51,200 | $16,477 | $34,723 |
| 2023 | $2,124 | $49,710 | $15,998 | $33,712 |
| 2022 | $2,053 | $48,262 | $15,532 | $32,730 |
| 2021 | $1,499 | $35,395 | $9,158 | $26,237 |
| 2020 | $1,474 | $34,364 | $8,891 | $25,473 |
| 2019 | $1,431 | $33,363 | $8,632 | $24,731 |
| 2018 | $969 | $33,363 | $8,632 | $24,731 |
| 2017 | $939 | $22,749 | $6,825 | $15,924 |
| 2016 | $912 | $21,443 | $6,433 | $15,010 |
| 2015 | $20,820 | $20,820 | $6,246 | $14,574 |
| 2014 | $858 | $20,213 | $6,064 | $14,149 |
| 2013 | -- | $27,863 | $8,632 | $19,231 |
Source: Public Records
Map
Nearby Homes
- 8524 Stony Creek Rd SW
- 4301 Blake Trailer 40 Rd SW
- 7901 Purple Fringe Rd SW
- 8600 Kimela Ct SW
- 2771 Butch Cassidy Dr SW
- 2503 Sancho Panza Way SW
- 7814 Desert Canyon Place SW
- 1420 Summerfield Place SW
- 9808 Morning Sun Trail SW
- 9901 Morning Sun Trail SW
- 9909 Saddlehorn Trail SW
- 9801 Sun Chaser Trail SW Unit 1
- 1815 Shadetree Dr SW
- 2724 Barcelona Place SW
- 1209 Locura Rd SW
- 1327 Amole Vista St SW
- 2408 Sun Gate Trail SW
- 7304 Autumn Sky Rd SW
- 3855 Villa Serena Place SW
- 2627 Sun Canyon Ln SW
- 2016 N Wind Dr SW
- 2008 N Wind Dr SW
- 2004 N Wind Dr SW
- 2100 N Wind Dr SW
- 8401 Winter Sage Rd SW
- 2104 N Wind Dr SW
- 2000 N Wind Dr SW
- 8405 Winter Sage Rd SW
- 8400 Bay Mare Ave SW
- 2108 N Wind Dr SW
- 8400 Winter Sage Rd SW
- 8409 Winter Sage Rd SW
- 8404 Bay Mare Ave SW
- 8404 Winter Sage Rd SW Unit 4A
- 2112 N Wind Dr SW
- 8415 Winter Sage Rd SW
- 8408 Winter Sage Rd SW
- 8305 Bay Mare Ave SW
- 8301 Bay Mare Ave SW
- 8408 Bay Mare Ave SW