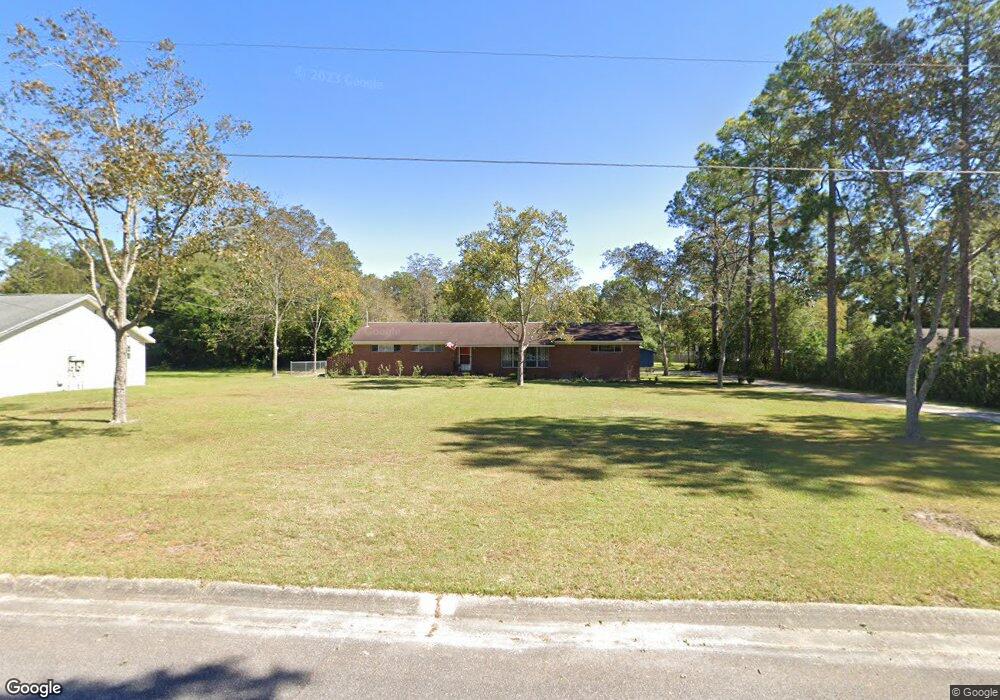
2012 Neal St Waycross, GA 31501
Estimated Value: $169,000 - $196,000
--
Bed
2
Baths
1,711
Sq Ft
$108/Sq Ft
Est. Value
About This Home
This home is located at 2012 Neal St, Waycross, GA 31501 and is currently estimated at $184,267, approximately $107 per square foot. 2012 Neal St is a home located in Ware County with nearby schools including Center Elementary School, Waycross Middle School, and Ware County High School.
Ownership History
Date
Name
Owned For
Owner Type
Purchase Details
Closed on
Aug 28, 2017
Sold by
Callahan Sharon M
Bought by
Callahan Scott Samuel
Current Estimated Value
Home Financials for this Owner
Home Financials are based on the most recent Mortgage that was taken out on this home.
Original Mortgage
$38,500
Outstanding Balance
$22,239
Interest Rate
3.92%
Mortgage Type
New Conventional
Estimated Equity
$162,028
Purchase Details
Closed on
Jun 12, 1987
Create a Home Valuation Report for This Property
The Home Valuation Report is an in-depth analysis detailing your home's value as well as a comparison with similar homes in the area
Home Values in the Area
Average Home Value in this Area
Purchase History
| Date | Buyer | Sale Price | Title Company |
|---|---|---|---|
| Callahan Scott Samuel | $70,000 | -- | |
| -- | -- | -- |
Source: Public Records
Mortgage History
| Date | Status | Borrower | Loan Amount |
|---|---|---|---|
| Open | Callahan Scott Samuel | $38,500 |
Source: Public Records
Tax History Compared to Growth
Tax History
| Year | Tax Paid | Tax Assessment Tax Assessment Total Assessment is a certain percentage of the fair market value that is determined by local assessors to be the total taxable value of land and additions on the property. | Land | Improvement |
|---|---|---|---|---|
| 2024 | $804 | $76,705 | $4,320 | $72,385 |
| 2023 | $820 | $51,116 | $2,434 | $48,682 |
| 2022 | $900 | $51,116 | $2,434 | $48,682 |
| 2021 | $928 | $39,431 | $2,434 | $36,997 |
| 2020 | $938 | $38,310 | $2,434 | $35,876 |
| 2019 | $957 | $32,707 | $2,434 | $30,273 |
| 2018 | $849 | $31,586 | $2,434 | $29,152 |
| 2017 | $392 | $37,770 | $2,411 | $35,359 |
| 2016 | $392 | $37,770 | $2,411 | $35,359 |
| 2015 | $395 | $37,770 | $2,411 | $35,359 |
| 2014 | $393 | $37,770 | $2,411 | $35,359 |
| 2013 | -- | $37,770 | $2,411 | $35,358 |
Source: Public Records
Map
Nearby Homes
- 904 Golfview Dr
- 2123 Sunnyside Dr
- 2312 Spurgeon St
- 1013 E Waring St
- 515 Summit St
- 2099 Ridge Rd
- 607 Linden Dr
- 2509 Tebeau St
- 601 Community Dr
- 2120 Tebeau St
- 2202 Pioneer St
- 1301 Riverside Ave
- 2022 Pioneer St
- 2706 Alice St
- 00 Pineview Dr
- 0 Pineview Dr
- 0 Beville St
- 404 Community Dr
- 2784 Autumn Ridge Ln
- 705 E Waring St
- 2016 Neal St
- 2010 Neal St
- 1004 Golfview Dr
- 1002 Golfview Dr
- 2015 Neal St
- 1006 Golfview Dr
- 2007 Fairway Dr
- 2006 Neal St
- 2005 Fairway Dr
- 2009 Fairway Dr
- 1025 E Blackshear Ave
- 912 Golfview Dr
- 2003 Fairway Dr
- 2011 Fairway Dr
- 1001 Golfview Dr
- 910 Golfview Dr
- 911 E Blackshear Ave
- 1005 Golfview Dr
- 2004 Fairway Dr
- 2008 Fairway Dr