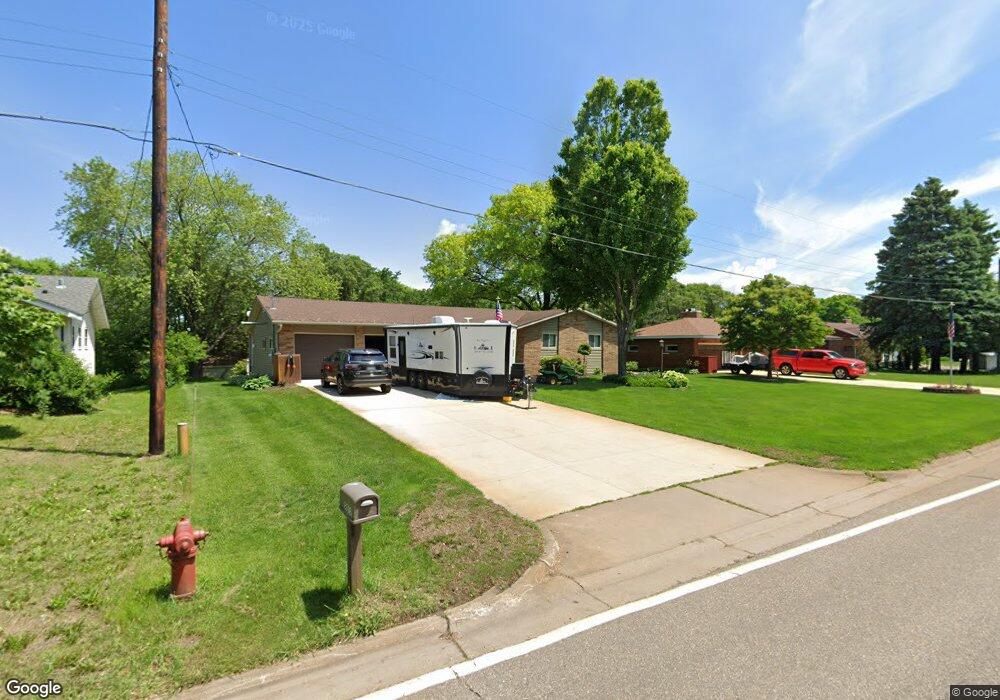
2012 Nininger Rd Hastings, MN 55033
Hastings-Marshan Township NeighborhoodEstimated Value: $375,000 - $476,000
3
Beds
2
Baths
1,200
Sq Ft
$360/Sq Ft
Est. Value
About This Home
This home is located at 2012 Nininger Rd, Hastings, MN 55033 and is currently estimated at $431,535, approximately $359 per square foot. 2012 Nininger Rd is a home located in Dakota County with nearby schools including Christa Mcauliffe Elementary School, Hastings Middle School, and Hastings High School.
Ownership History
Date
Name
Owned For
Owner Type
Purchase Details
Closed on
Jul 14, 2016
Sold by
Pope David John and Zuzek Patricia M
Bought by
Pugh Alecia M
Current Estimated Value
Home Financials for this Owner
Home Financials are based on the most recent Mortgage that was taken out on this home.
Original Mortgage
$191,600
Outstanding Balance
$153,053
Interest Rate
3.6%
Mortgage Type
New Conventional
Estimated Equity
$278,482
Purchase Details
Closed on
May 31, 2012
Sold by
Zuzek Patricia
Bought by
Pope David John
Home Financials for this Owner
Home Financials are based on the most recent Mortgage that was taken out on this home.
Original Mortgage
$206,196
Interest Rate
3.87%
Mortgage Type
FHA
Purchase Details
Closed on
Sep 4, 2009
Sold by
Zuzek Elaine
Bought by
Zuzek Patricia
Home Financials for this Owner
Home Financials are based on the most recent Mortgage that was taken out on this home.
Original Mortgage
$164,000
Interest Rate
5.19%
Mortgage Type
New Conventional
Create a Home Valuation Report for This Property
The Home Valuation Report is an in-depth analysis detailing your home's value as well as a comparison with similar homes in the area
Home Values in the Area
Average Home Value in this Area
Purchase History
| Date | Buyer | Sale Price | Title Company |
|---|---|---|---|
| Pugh Alecia M | $286,612 | Burnet Title | |
| Pope David John | $210,000 | Trademark Title Services | |
| Zuzek Patricia | $205,000 | Trademark Title Services | |
| Zuzek Patricia | $205,000 | -- | |
| Zuzek Elaine | $205,000 | -- |
Source: Public Records
Mortgage History
| Date | Status | Borrower | Loan Amount |
|---|---|---|---|
| Open | Pugh Alecia M | $191,600 | |
| Previous Owner | Pope David John | $206,196 | |
| Previous Owner | Zuzek Elaine | $164,000 | |
| Closed | Zuzek Patricia | -- |
Source: Public Records
Tax History Compared to Growth
Tax History
| Year | Tax Paid | Tax Assessment Tax Assessment Total Assessment is a certain percentage of the fair market value that is determined by local assessors to be the total taxable value of land and additions on the property. | Land | Improvement |
|---|---|---|---|---|
| 2024 | $4,520 | $388,500 | $105,200 | $283,300 |
| 2023 | $4,520 | $392,900 | $105,300 | $287,600 |
| 2022 | $3,834 | $388,300 | $105,100 | $283,200 |
| 2021 | $3,648 | $318,300 | $91,400 | $226,900 |
| 2020 | $3,788 | $302,300 | $87,100 | $215,200 |
| 2019 | $3,680 | $303,200 | $82,900 | $220,300 |
| 2018 | $3,421 | $281,700 | $79,000 | $202,700 |
| 2017 | $3,069 | $255,800 | $75,200 | $180,600 |
| 2016 | $3,109 | $231,600 | $70,300 | $161,300 |
| 2015 | $2,964 | $212,261 | $63,242 | $149,019 |
| 2014 | -- | $203,323 | $60,527 | $142,796 |
| 2013 | -- | $168,334 | $53,106 | $115,228 |
Source: Public Records
Map
Nearby Homes
- 1306 Lincoln Ln
- 1404 Featherstone Rd
- 1372 Featherstone Rd
- 300 Whispering Ln Unit 201
- 101 Farm St Unit A
- 325 Crestview Dr
- 101 Fraiser St
- 401 Whispering Ln
- 404 Pleasant Dr
- 145x 4th St W
- 642 Pleasant Dr
- 12109 131st Street Ct S
- 900 5th St W
- 822 5th St W
- 1100 Honeysuckle Ln
- 930 Lyn Way Unit 204
- 626 6th St W
- 11813 122nd Street Cir S
- 516 4th St W
- 1882 13th St W Unit 802
- 2016 Nininger Rd
- 2008 Nininger Rd
- 1355 Eagle Bluff Cir
- 1353 Eagle Bluff Cir
- 2004 Nininger Rd
- 2020 Nininger Rd
- 1359 Eagle Bluff Cir
- 1416 Roosevelt Rd
- 1420 Roosevelt Rd
- 1410 Roosevelt Rd
- 1403 Liddle Ln
- 1351 Eagle Bluff Cir
- 2024 Nininger Rd
- 1323 Eagle Bluff Ct
- 11 Monroe St
- 1406 Roosevelt Rd
- 1361 Eagle Bluff Cir
- 1996 Nininger Rd
- 19 Monroe St
- 1347 Eagle Bluff Cir