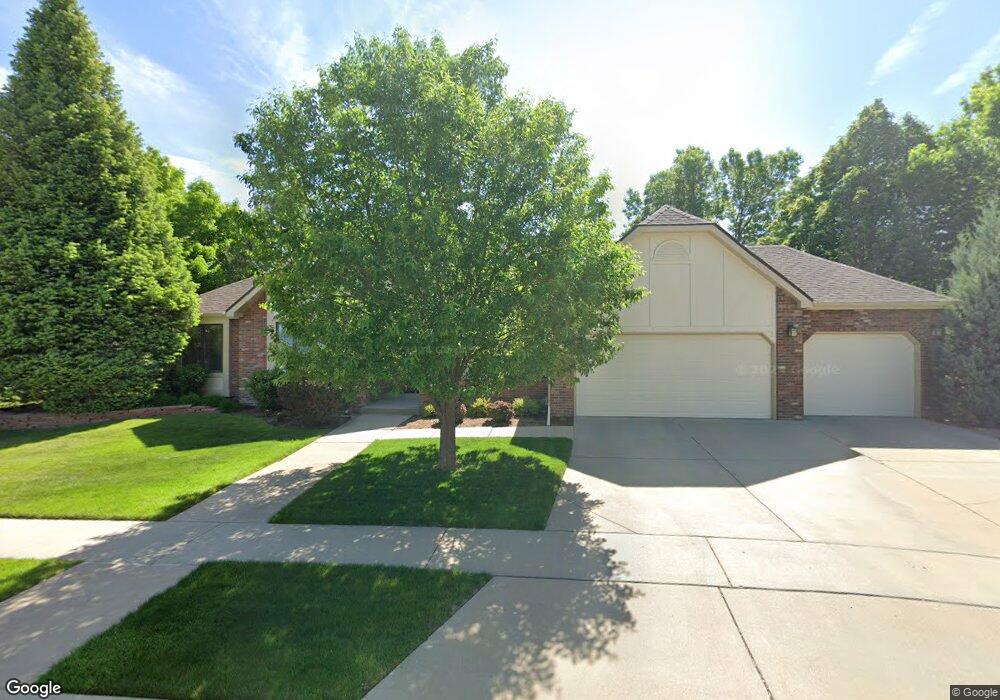
2012 Ridgeview Dr Longmont, CO 80504
Pike NeighborhoodEstimated Value: $802,213 - $1,036,000
4
Beds
4
Baths
2,078
Sq Ft
$449/Sq Ft
Est. Value
About This Home
This home is located at 2012 Ridgeview Dr, Longmont, CO 80504 and is currently estimated at $932,053, approximately $448 per square foot. 2012 Ridgeview Dr is a home located in Boulder County with nearby schools including Indian Peaks Elementary School, Sunset Middle School, and Niwot High School.
Ownership History
Date
Name
Owned For
Owner Type
Purchase Details
Closed on
Jun 23, 2003
Sold by
Breeden Robert and Breeden Marjorie
Bought by
Breeden Robert A and Breeden Marjorie A
Current Estimated Value
Home Financials for this Owner
Home Financials are based on the most recent Mortgage that was taken out on this home.
Original Mortgage
$197,500
Interest Rate
5.27%
Mortgage Type
Purchase Money Mortgage
Purchase Details
Closed on
Sep 25, 1997
Sold by
Ann Johnson Terry Lee and Ann Margaret
Bought by
Breeden Robert A
Home Financials for this Owner
Home Financials are based on the most recent Mortgage that was taken out on this home.
Original Mortgage
$214,600
Interest Rate
7.56%
Purchase Details
Closed on
May 15, 1992
Bought by
Breeden Robert A and Breeden Marjorie A
Purchase Details
Closed on
Jan 3, 1992
Bought by
Breeden Robert A and Breeden Marjorie A
Purchase Details
Closed on
Dec 28, 1989
Bought by
Breeden Robert A and Breeden Marjorie A
Create a Home Valuation Report for This Property
The Home Valuation Report is an in-depth analysis detailing your home's value as well as a comparison with similar homes in the area
Home Values in the Area
Average Home Value in this Area
Purchase History
| Date | Buyer | Sale Price | Title Company |
|---|---|---|---|
| Breeden Robert A | -- | -- | |
| Breeden Robert | -- | Commonwealth Title | |
| Breeden Robert A | $317,500 | -- | |
| Breeden Robert A | $248,000 | -- | |
| Breeden Robert A | $48,000 | -- | |
| Breeden Robert A | -- | -- |
Source: Public Records
Mortgage History
| Date | Status | Borrower | Loan Amount |
|---|---|---|---|
| Closed | Breeden Robert | $197,500 | |
| Closed | Breeden Robert A | $214,600 |
Source: Public Records
Tax History
| Year | Tax Paid | Tax Assessment Tax Assessment Total Assessment is a certain percentage of the fair market value that is determined by local assessors to be the total taxable value of land and additions on the property. | Land | Improvement |
|---|---|---|---|---|
| 2025 | $5,024 | $58,100 | $12,906 | $45,194 |
| 2024 | $5,024 | $58,100 | $12,906 | $45,194 |
| 2023 | $4,955 | $59,221 | $13,715 | $49,191 |
| 2022 | $4,102 | $48,407 | $10,481 | $37,926 |
| 2021 | $4,156 | $49,800 | $10,782 | $39,018 |
| 2020 | $3,820 | $46,475 | $14,443 | $32,032 |
| 2019 | $3,760 | $46,475 | $14,443 | $32,032 |
| 2018 | $2,933 | $38,081 | $12,024 | $26,057 |
| 2017 | $2,893 | $42,100 | $13,293 | $28,807 |
| 2016 | $2,926 | $38,574 | $13,691 | $24,883 |
| 2015 | $2,789 | $34,419 | $8,836 | $25,583 |
| 2014 | $2,471 | $34,419 | $8,836 | $25,583 |
Source: Public Records
Map
Nearby Homes
- 2020 Diamond Dr
- 1331 Ruby Way
- 2062 Ridgeview Dr
- 1991 Amethyst Dr
- 1922 Amethyst Dr
- 2240 Summitview Dr
- 2133 Ridgeview Way
- 1745 S Pratt Pkwy
- 2215 Parkview Dr
- 905 Tempted Ways Dr
- 903 Tempted Ways Dr
- 900 Half Measures Dr
- 901 Tempted Ways Dr
- 2106 Andrew Alden St
- 801 Confidence Dr Unit 8
- 801 Confidence Dr Unit 20
- 722 Tenacity Dr Unit A
- 2307 Bluebird Dr
- 1105 Neon Forest Cir
- 2139 Springs Place
- 2021 Diamond Dr
- 2006 Ridgeview Dr
- 2018 Ridgeview Dr
- 2011 Diamond Dr
- 2031 Diamond Dr
- 2024 Ridgeview Dr
- 2000 Ridgeview Dr
- 2030 Ridgeview Dr
- 2036 Ridgeview Dr
- 2001 Diamond Dr
- 1327 Onyx Cir
- 2040 Diamond Dr
- 1960 Ridgeview Dr
- 1333 Onyx Cir
- 2010 Diamond Dr
- 1321 Onyx Cir
- 2001 Ridgeview Dr
- 2030 Diamond Dr
- 2011 Ridgeview Dr
- 1339 Onyx Cir
Your Personal Tour Guide
Ask me questions while you tour the home.