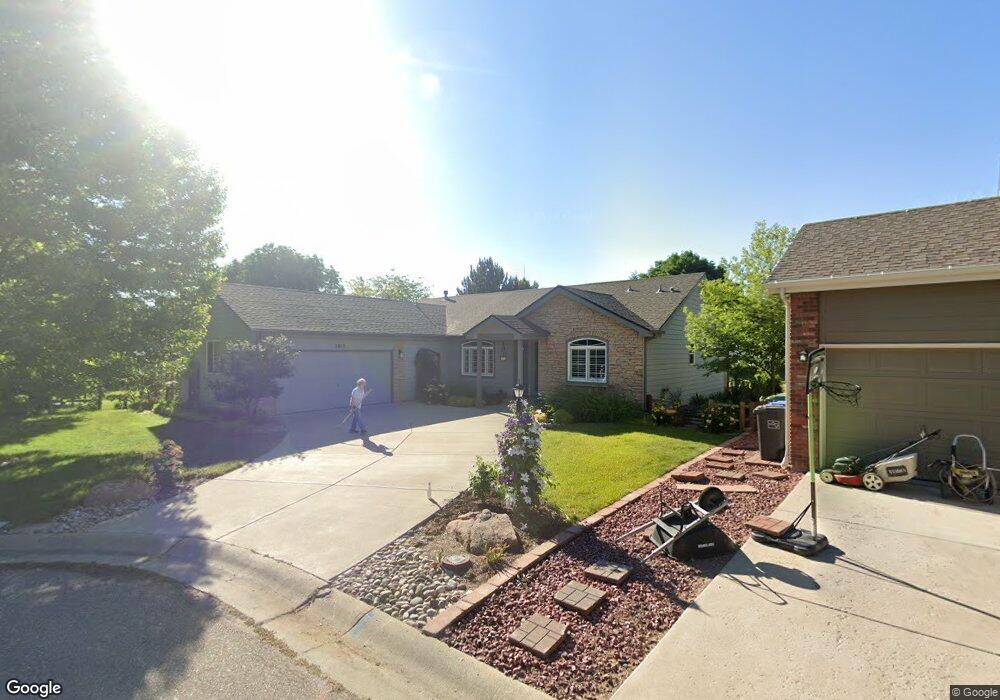
2012 Rodgers Ct Loveland, CO 80537
Estimated Value: $508,973 - $592,000
3
Beds
2
Baths
1,734
Sq Ft
$320/Sq Ft
Est. Value
About This Home
This home is located at 2012 Rodgers Ct, Loveland, CO 80537 and is currently estimated at $554,493, approximately $319 per square foot. 2012 Rodgers Ct is a home located in Larimer County with nearby schools including Garfield Elementary School, Bill Reed Middle School, and Thompson Valley High School.
Ownership History
Date
Name
Owned For
Owner Type
Purchase Details
Closed on
May 3, 2021
Sold by
Kirkwood Brady Aleander
Bought by
Caron Gerald F and Caron Nina J
Current Estimated Value
Purchase Details
Closed on
Sep 26, 2003
Sold by
Stanford Richard B and Stanford Rikka M
Bought by
Kolarich Roger and Kolarich Donna
Purchase Details
Closed on
Dec 18, 1998
Sold by
Gemm Homes Llc
Bought by
Stanford Richard B and Stanford Rikka M
Home Financials for this Owner
Home Financials are based on the most recent Mortgage that was taken out on this home.
Original Mortgage
$103,000
Interest Rate
6.92%
Purchase Details
Closed on
May 18, 1998
Sold by
Vanguard Holdings Llc
Bought by
Gemm Homes Llc
Home Financials for this Owner
Home Financials are based on the most recent Mortgage that was taken out on this home.
Original Mortgage
$148,000
Interest Rate
7.11%
Mortgage Type
Construction
Create a Home Valuation Report for This Property
The Home Valuation Report is an in-depth analysis detailing your home's value as well as a comparison with similar homes in the area
Home Values in the Area
Average Home Value in this Area
Purchase History
| Date | Buyer | Sale Price | Title Company |
|---|---|---|---|
| Caron Gerald F | $730,000 | Land Title Services | |
| Kolarich Roger | $242,000 | -- | |
| Stanford Richard B | $183,000 | Stewart Title | |
| Gemm Homes Llc | -- | Security Title |
Source: Public Records
Mortgage History
| Date | Status | Borrower | Loan Amount |
|---|---|---|---|
| Previous Owner | Stanford Richard B | $103,000 | |
| Previous Owner | Gemm Homes Llc | $148,000 |
Source: Public Records
Tax History Compared to Growth
Tax History
| Year | Tax Paid | Tax Assessment Tax Assessment Total Assessment is a certain percentage of the fair market value that is determined by local assessors to be the total taxable value of land and additions on the property. | Land | Improvement |
|---|---|---|---|---|
| 2025 | $2,068 | $36,301 | $2,700 | $33,601 |
| 2024 | $1,995 | $36,301 | $2,700 | $33,601 |
| 2022 | $1,658 | $27,786 | $2,801 | $24,985 |
| 2021 | $1,704 | $28,585 | $2,881 | $25,704 |
| 2020 | $1,632 | $27,677 | $2,881 | $24,796 |
| 2019 | $1,605 | $27,677 | $2,881 | $24,796 |
| 2018 | $1,449 | $24,812 | $2,902 | $21,910 |
| 2017 | $1,248 | $24,812 | $2,902 | $21,910 |
| 2016 | $1,038 | $22,113 | $3,208 | $18,905 |
| 2015 | $1,030 | $22,120 | $3,210 | $18,910 |
| 2014 | $1,420 | $18,880 | $3,210 | $15,670 |
Source: Public Records
Map
Nearby Homes
- 1725 Keyes Ct
- 229 Blossom Dr
- 2120 3rd St SW Unit 1
- 332 Terri Dr
- 1786 Wintergreen Place
- 432 Glenda Dr
- 2583 Begonia Ct
- 486 Natasha Ct
- 1404 W 6th St
- 1714 W 8th St
- 628 Jocelyn Dr
- 901 W Kelly Dr
- 677 Gayla Ct
- 1658 Taft Gardens Cir
- 621 Split Rock Dr
- 706 S Gilpin Ave
- 1667 Taft Gardens Cir
- 1230 W 6th St
- 796 S Tyler Ave
- 2821 5th St SW
- 2028 Rodgers Ct
- 2003 Rodgers Ct
- 2044 Rodgers Ct
- 177 Boutwell Ct
- 1834 Bushnell Dr
- 2015 Calhoun Ct
- 193 Boutwell Ct
- 2019 Rodgers Ct
- 161 Boutwell Ct
- 1856 Bushnell Dr
- 2035 Rodgers Ct
- 2060 Rodgers Ct
- 2051 Rodgers Ct
- 145 Boutwell Ct
- 2008 Calhoun Ct
- 2031 Calhoun Ct
- 1976 Bushnell Dr
- 1880 Bushnell Dr
- 2067 Rodgers Ct
- 2076 Rodgers Ct