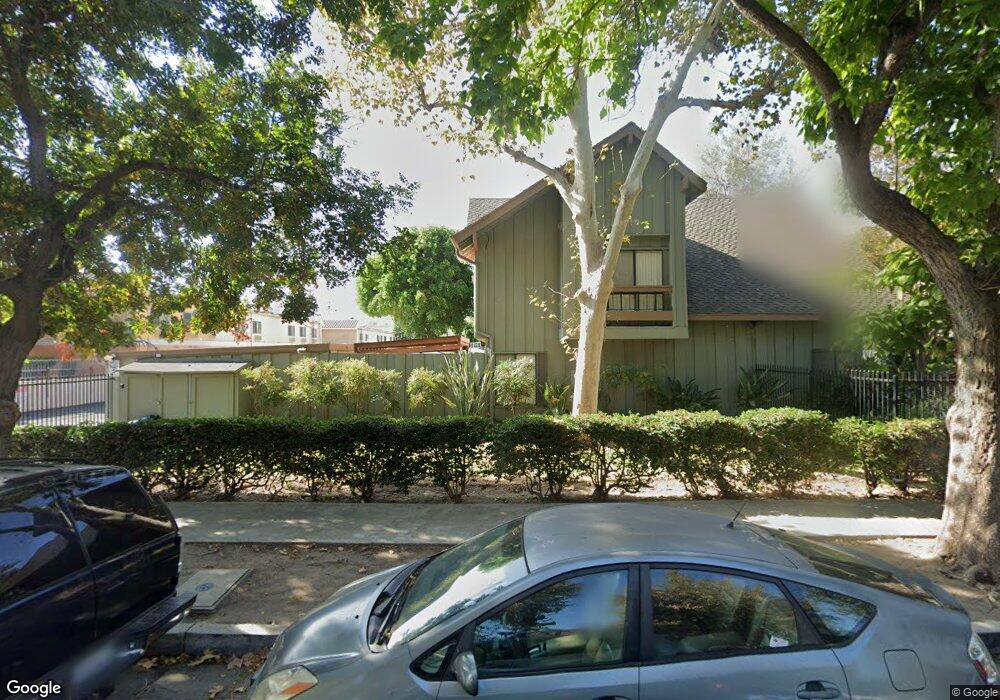
20120 Runnymede St Unit 18 Winnetka, CA 91306
Estimated Value: $509,905 - $527,000
2
Beds
3
Baths
1,337
Sq Ft
$387/Sq Ft
Est. Value
About This Home
This home is located at 20120 Runnymede St Unit 18, Winnetka, CA 91306 and is currently estimated at $517,976, approximately $387 per square foot. 20120 Runnymede St Unit 18 is a home located in Los Angeles County with nearby schools including Stanley Mosk Elementary School, John A. Sutter Middle School, and Northridge Academy High.
Ownership History
Date
Name
Owned For
Owner Type
Purchase Details
Closed on
Jul 29, 2011
Sold by
Wan Amy and Marsh Sherri
Bought by
Khen Yosef and Haviv Tirza
Current Estimated Value
Home Financials for this Owner
Home Financials are based on the most recent Mortgage that was taken out on this home.
Original Mortgage
$100,000
Interest Rate
4.37%
Mortgage Type
New Conventional
Purchase Details
Closed on
Mar 25, 2010
Sold by
Huber Robert J
Bought by
Huber Robert J and Robert J Huber Revocable Trust
Create a Home Valuation Report for This Property
The Home Valuation Report is an in-depth analysis detailing your home's value as well as a comparison with similar homes in the area
Home Values in the Area
Average Home Value in this Area
Purchase History
| Date | Buyer | Sale Price | Title Company |
|---|---|---|---|
| Khen Yosef | $167,000 | Orange Coast Title | |
| Huber Robert J | -- | None Available |
Source: Public Records
Mortgage History
| Date | Status | Borrower | Loan Amount |
|---|---|---|---|
| Previous Owner | Khen Yosef | $100,000 |
Source: Public Records
Tax History Compared to Growth
Tax History
| Year | Tax Paid | Tax Assessment Tax Assessment Total Assessment is a certain percentage of the fair market value that is determined by local assessors to be the total taxable value of land and additions on the property. | Land | Improvement |
|---|---|---|---|---|
| 2025 | $2,697 | $209,751 | $48,605 | $161,146 |
| 2024 | $2,697 | $205,639 | $47,652 | $157,987 |
| 2023 | $2,648 | $201,608 | $46,718 | $154,890 |
| 2022 | $2,528 | $197,655 | $45,802 | $151,853 |
| 2021 | $2,491 | $193,780 | $44,904 | $148,876 |
| 2019 | $2,419 | $188,034 | $43,573 | $144,461 |
| 2018 | $2,367 | $184,348 | $42,719 | $141,629 |
| 2016 | $2,250 | $177,191 | $41,061 | $136,130 |
| 2015 | $2,219 | $174,531 | $40,445 | $134,086 |
| 2014 | $2,233 | $171,113 | $39,653 | $131,460 |
Source: Public Records
Map
Nearby Homes
- 20134 Leadwell St Unit 374
- 20134 Leadwell St Unit 156
- 20134 Leadwell St Unit 133
- 20258 Cohasset St Unit 4
- 20258 Runnymede St
- 7401 Casaba Ave
- 7516 Oakdale Ave
- 7640 Oso Ave Unit 316
- 7640 Oso Ave Unit 217
- 20327 Saticoy St Unit 102
- 20253 Keswick St Unit 326
- 20253 Keswick St Unit 103
- 20253 Keswick St Unit 233
- 20008 Sherman Way Unit D
- 20224 Sherman Way Unit 26
- 20224 Sherman Way Unit 14
- 20442 Runnymede St
- 20254 Stagg St
- 20528 & 20526 Hamlin St
- 20819 W Seasons Ln
- 20120 Runnymede St Unit 20
- 20140 Runnymede St Unit 39
- 20134 Runnymede St Unit 35
- 20130 Runnymede St Unit 27
- 20120 Runnymede St Unit 16
- 20140 Runnymede St Unit 38
- 20126 Runnymede St Unit 22
- 20130 Runnymede St Unit 30
- 20134 Runnymede St Unit 37
- 20126 Runnymede St Unit 23
- 20134 Runnymede St Unit 33
- 20120 Runnymede St Unit 21
- 20140 Runnymede St Unit 42
- 20140 Runnymede St Unit 41
- 20126 Runnymede St Unit 25
- 20120 Runnymede St Unit 15
- 20126 Runnymede St Unit 26
- 20126 Runnymede St Unit 24
- 20134 Runnymede St Unit 36
- 20134 Runnymede St Unit 34