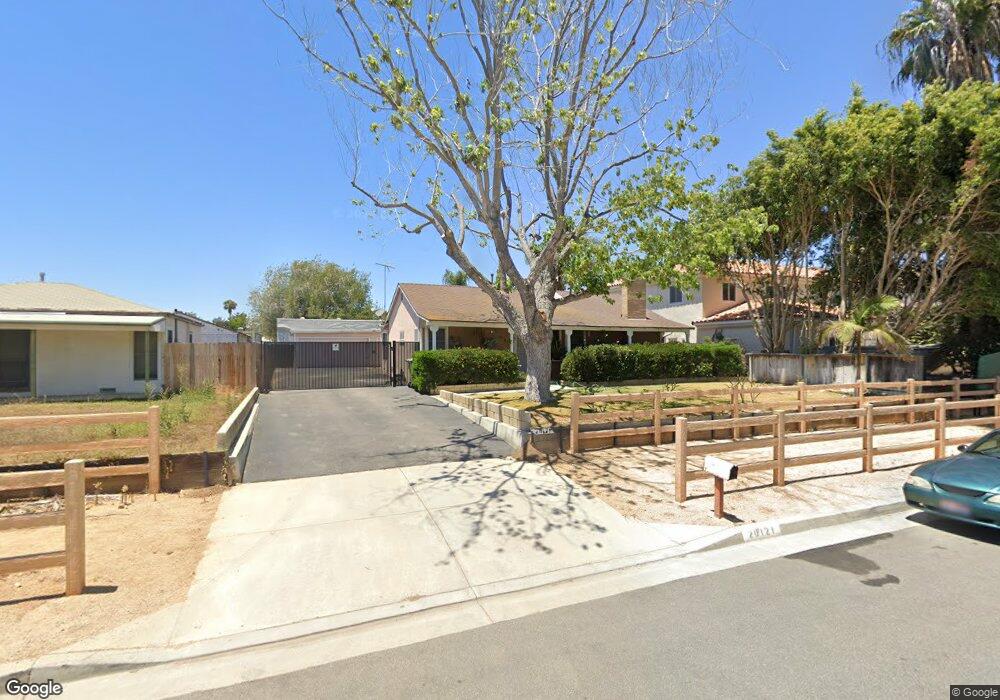
20121 SW Cypress St Newport Beach, CA 92660
Bayview NeighborhoodEstimated Value: $2,022,000 - $2,874,000
3
Beds
2
Baths
1,710
Sq Ft
$1,423/Sq Ft
Est. Value
About This Home
This home is located at 20121 SW Cypress St, Newport Beach, CA 92660 and is currently estimated at $2,433,337, approximately $1,423 per square foot. 20121 SW Cypress St is a home located in Orange County with nearby schools including Mariners Elementary School, Horace Ensign Intermediate School, and Newport Harbor High School.
Ownership History
Date
Name
Owned For
Owner Type
Purchase Details
Closed on
Apr 3, 2025
Sold by
Batchelder Family Trust and Watrous Elaine
Bought by
Batchelder Family Trust and Watrous
Current Estimated Value
Purchase Details
Closed on
Dec 2, 2021
Sold by
Batchelder Alice M and The Batchelder Family Trust
Bought by
Batchelder Alice M and The Batchelder Family Trust
Purchase Details
Closed on
Oct 4, 2021
Sold by
Batchelder Alice M and Batchelder Family Trust
Bought by
Batchelder Alice M and The Batchelder Family Trust
Purchase Details
Closed on
Feb 27, 2002
Sold by
Batchelder Norman W and Batchelder Alice M
Bought by
Batchelder Norman W and Batchelder Alice M
Purchase Details
Closed on
Dec 13, 2000
Sold by
Batchelder Norman W and Batchelder Alice M
Bought by
Batchelder Norman W and Batchelder Alice M
Home Financials for this Owner
Home Financials are based on the most recent Mortgage that was taken out on this home.
Original Mortgage
$56,000
Interest Rate
7.81%
Create a Home Valuation Report for This Property
The Home Valuation Report is an in-depth analysis detailing your home's value as well as a comparison with similar homes in the area
Home Values in the Area
Average Home Value in this Area
Purchase History
| Date | Buyer | Sale Price | Title Company |
|---|---|---|---|
| Batchelder Family Trust | -- | None Listed On Document | |
| Batchelder Alice M | -- | None Available | |
| Batchelder Alice M | -- | None Available | |
| Batchelder Norman W | -- | -- | |
| Batchelder Norman W | -- | First American Title Ins Co |
Source: Public Records
Mortgage History
| Date | Status | Borrower | Loan Amount |
|---|---|---|---|
| Previous Owner | Batchelder Norman W | $56,000 |
Source: Public Records
Tax History Compared to Growth
Tax History
| Year | Tax Paid | Tax Assessment Tax Assessment Total Assessment is a certain percentage of the fair market value that is determined by local assessors to be the total taxable value of land and additions on the property. | Land | Improvement |
|---|---|---|---|---|
| 2025 | $21,357 | $948,104 | $902,010 | $46,094 |
| 2024 | $21,357 | $1,950,000 | $1,855,194 | $94,806 |
| 2023 | $1,895 | $105,745 | $47,188 | $58,557 |
| 2022 | $1,832 | $103,672 | $46,263 | $57,409 |
| 2021 | $1,708 | $101,640 | $45,356 | $56,284 |
| 2020 | $1,677 | $100,598 | $44,891 | $55,707 |
| 2019 | $1,639 | $98,626 | $44,011 | $54,615 |
| 2018 | $1,605 | $96,693 | $43,148 | $53,545 |
| 2017 | $1,582 | $94,798 | $42,302 | $52,496 |
| 2016 | $1,554 | $92,940 | $41,473 | $51,467 |
| 2015 | $1,537 | $91,544 | $40,850 | $50,694 |
| 2014 | $1,506 | $89,751 | $40,050 | $49,701 |
Source: Public Records
Map
Nearby Homes
- 2173 Orchard Dr
- 2262 Orchard Dr
- 20122 Orchid St
- 20301 SW Cypress St
- 20091 Spruce Ave
- 20171 Bayview Ave
- 20382 SW Cypress St
- 20391 SW Cypress St
- 20431 SW Cypress St
- 48 Baycrest Ct Unit 32
- 2321 Mesa Dr
- 43 Gannet Ln
- 78 Pelican Ct
- 24 Cormorant Cir
- 2207 Golden Cir
- 20142 Kline Dr
- 333 Mesa Dr
- 20462 Santa Ana Ave Unit D
- 4261 Uptown Newport Dr Unit 6P
- 4261 Uptown Newport Dr Unit 1
- 20111 SW Cypress St
- 20131 SW Cypress St
- 20122 SW Cypress St
- 20151 SW Cypress St
- 20111 SW Birch St
- 20081 SW Cypress St
- 20152 SW Cypress St
- 20161 SW Cypress St
- 20102 SW Cypress St
- 20162 SW Cypress St
- 20112 SW Cypress St
- 20132 SW Cypress St
- 20071 SW Cypress St
- 20071 SW Cypress St
- 20171 SW Cypress St
- 20072 SW Cypress St
- 20181 SW Cypress St
- 20172 SW Cypress St
- 20192 SW Cypress St
- 20062 SW Cypress St