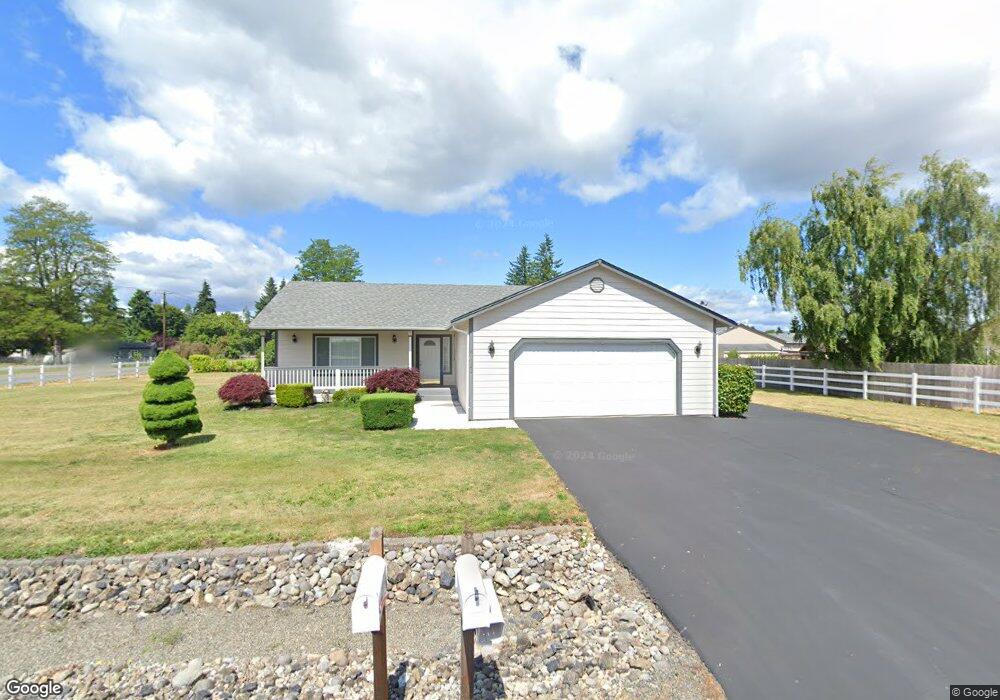
20122 Tahoma Loop SW Rochester, WA 98579
Estimated Value: $468,641 - $518,000
3
Beds
2
Baths
1,380
Sq Ft
$360/Sq Ft
Est. Value
About This Home
This home is located at 20122 Tahoma Loop SW, Rochester, WA 98579 and is currently estimated at $496,910, approximately $360 per square foot. 20122 Tahoma Loop SW is a home located in Thurston County with nearby schools including Rochester Primary School, Grand Mound Elementary School, and Rochester Middle School.
Ownership History
Date
Name
Owned For
Owner Type
Purchase Details
Closed on
Sep 2, 2021
Sold by
Eisenbeis May A
Bought by
Smith Ronald Neil
Current Estimated Value
Home Financials for this Owner
Home Financials are based on the most recent Mortgage that was taken out on this home.
Original Mortgage
$50,000
Outstanding Balance
$45,428
Interest Rate
2.7%
Mortgage Type
Credit Line Revolving
Estimated Equity
$451,482
Purchase Details
Closed on
Aug 22, 2002
Sold by
Hinkle Homes Inc
Bought by
Eisenbeis Delmar W and Eisenbeis Mary A
Home Financials for this Owner
Home Financials are based on the most recent Mortgage that was taken out on this home.
Original Mortgage
$45,000
Interest Rate
6.52%
Purchase Details
Closed on
Mar 14, 2002
Sold by
Vanderkolk Dan and Vanderkolk Nailla
Bought by
Hinkle Homes Inc
Home Financials for this Owner
Home Financials are based on the most recent Mortgage that was taken out on this home.
Original Mortgage
$101,900
Interest Rate
6.85%
Create a Home Valuation Report for This Property
The Home Valuation Report is an in-depth analysis detailing your home's value as well as a comparison with similar homes in the area
Home Values in the Area
Average Home Value in this Area
Purchase History
| Date | Buyer | Sale Price | Title Company |
|---|---|---|---|
| Smith Ronald Neil | $408,000 | Thurston County Title Co | |
| Eisenbeis Delmar W | -- | Thurston County Title Co | |
| Hinkle Homes Inc | -- | Thurston County Title Co |
Source: Public Records
Mortgage History
| Date | Status | Borrower | Loan Amount |
|---|---|---|---|
| Open | Smith Ronald Neil | $50,000 | |
| Previous Owner | Eisenbeis Delmar W | $45,000 | |
| Previous Owner | Hinkle Homes Inc | $101,900 |
Source: Public Records
Tax History Compared to Growth
Tax History
| Year | Tax Paid | Tax Assessment Tax Assessment Total Assessment is a certain percentage of the fair market value that is determined by local assessors to be the total taxable value of land and additions on the property. | Land | Improvement |
|---|---|---|---|---|
| 2024 | $3,304 | $398,400 | $128,100 | $270,300 |
| 2023 | $3,304 | $381,400 | $96,000 | $285,400 |
| 2022 | $2,854 | $369,000 | $75,900 | $293,100 |
| 2021 | $761 | $276,900 | $75,700 | $201,200 |
| 2020 | $789 | $254,100 | $52,200 | $201,900 |
| 2019 | $1,238 | $218,300 | $45,200 | $173,100 |
| 2018 | $1,256 | $206,500 | $42,300 | $164,200 |
| 2017 | $1,421 | $198,650 | $41,850 | $156,800 |
| 2016 | $2,613 | $183,350 | $42,950 | $140,400 |
| 2014 | -- | $181,050 | $41,350 | $139,700 |
Source: Public Records
Map
Nearby Homes
- 20005 Carper Rd SW
- 20102 Rainy Ln SW
- 7140 196th Ave SW
- 19139 Rosemary St SW
- 19140 Rosemary St SW
- 7140 191st Ave SW Unit 26
- 8045 Prather Rd SW
- 20000 Kuper Ct
- 0 Roseburg St SW Unit NWM2371565
- 6521 201st Ave SW
- 6511 203rd Ave SW
- 19714 Aspenwood Ct SW
- 6411 201st Ave SW Unit 21
- 18549 Roseburg St SW
- 8815 Prather Rd SW
- 7245 185th Ln SW
- 0 Hwy 12 SW Unit NWM2363119
- 22010 Summers Rd
- 6201 203rd Ave SW Unit 14
- 9727 Lundeen Rd SW
- 20122 Tahoma Loop SW
- 20106 Tahoma Loop SW
- 20119 Tahoma Loop SW
- 19937 Tahoma Cir SW
- 8123 James Rd SW
- 20115 Tahoma Loop SW
- 19936 Tahoma Cir SW
- 19931 Tahoma Cir SW
- 8124 James Rd SW
- 19939 Tahoma Cir SW
- 19928 Tahoma Cir SW
- 20044 Jowsey Ct SW
- 19930 Tahoma Cir SW
- 20102 Tahoma Loop SW
- 19933 Tahoma Cir SW
- 19925 Tahoma Cir SW
- 20038 Jowsey Ct SW
- 19924 Tahoma Cir SW
- 20043 Jowsey Ct SW
- 19926 Tahoma Cir SW