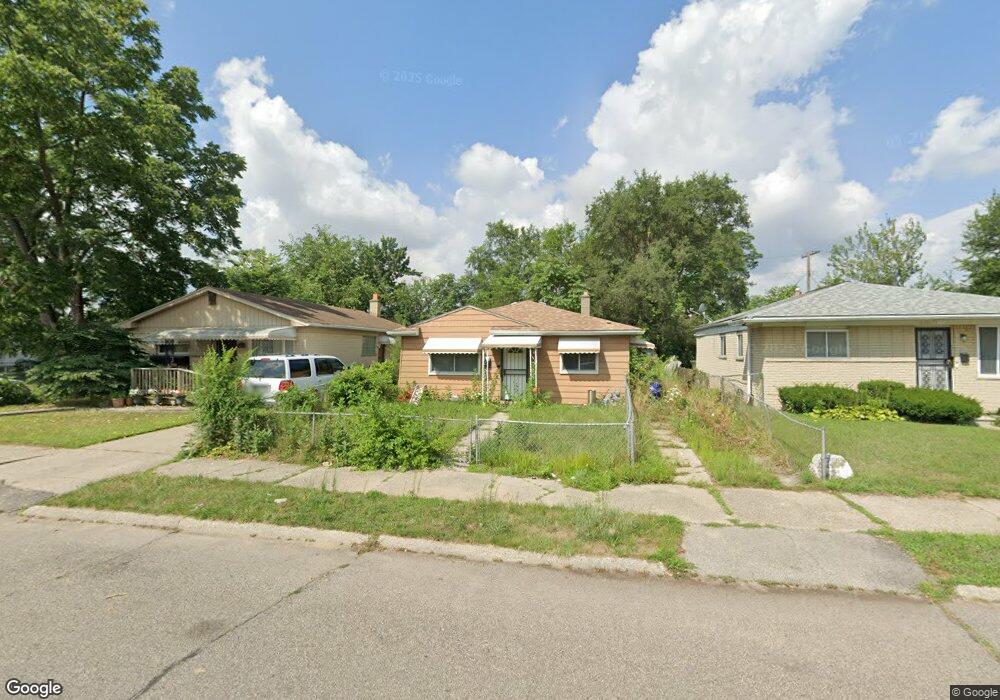
20127 Kentucky St Detroit, MI 48221
Garden Homes NeighborhoodEstimated Value: $86,721 - $111,000
3
Beds
1
Bath
1,000
Sq Ft
$95/Sq Ft
Est. Value
About This Home
This home is located at 20127 Kentucky St, Detroit, MI 48221 and is currently estimated at $94,930, approximately $94 per square foot. 20127 Kentucky St is a home located in Wayne County with nearby schools including Pasteur Elementary School, Charles L. Spain Elementary-Middle School, and Edward 'Duke' Ellington Conservatory of Music and Art.
Ownership History
Date
Name
Owned For
Owner Type
Purchase Details
Closed on
Sep 5, 2025
Sold by
Jefferson Latheresa
Bought by
Zeigler Latisa
Current Estimated Value
Purchase Details
Closed on
Jul 16, 2024
Sold by
James-Hooper Latisa
Bought by
Exquisite Creations Cleaning Services
Purchase Details
Closed on
Jan 3, 2019
Sold by
Rose Solutions Inc
Bought by
James-Hooper Latisa
Purchase Details
Closed on
Feb 28, 2017
Sold by
Leach Guy
Bought by
Rose Solutins Inc
Purchase Details
Closed on
Nov 22, 2011
Sold by
Wayne County Treasurer
Bought by
Leach Guy
Purchase Details
Closed on
Feb 25, 2008
Sold by
Fremont Invest & Loans
Bought by
Residential Mortgage Solutions Llc
Purchase Details
Closed on
Nov 9, 2006
Sold by
Carter Xavier T
Bought by
Fremont Investment & Loan
Purchase Details
Closed on
Apr 13, 2006
Sold by
Lemmons Denise P and Fitch Earl
Bought by
Carter Xavier T
Create a Home Valuation Report for This Property
The Home Valuation Report is an in-depth analysis detailing your home's value as well as a comparison with similar homes in the area
Home Values in the Area
Average Home Value in this Area
Purchase History
| Date | Buyer | Sale Price | Title Company |
|---|---|---|---|
| Zeigler Latisa | -- | None Listed On Document | |
| Exquisite Creations Cleaning Services | -- | None Listed On Document | |
| James-Hooper Latisa | -- | None Available | |
| Rose Solutins Inc | -- | None Available | |
| Leach Guy | $2,100 | None Available | |
| Residential Mortgage Solutions Llc | -- | Attorneys Title Agency Llc | |
| Wells Brandon | $5,000 | Attorneys Title Agency Llc | |
| Fremont Investment & Loan | $36,000 | None Available | |
| Carter Xavier T | $64,000 | Title Resource |
Source: Public Records
Tax History Compared to Growth
Tax History
| Year | Tax Paid | Tax Assessment Tax Assessment Total Assessment is a certain percentage of the fair market value that is determined by local assessors to be the total taxable value of land and additions on the property. | Land | Improvement |
|---|---|---|---|---|
| 2025 | $1,332 | $36,800 | $0 | $0 |
| 2024 | $1,332 | $31,300 | $0 | $0 |
| 2023 | $1,292 | $24,300 | $0 | $0 |
| 2022 | $1,296 | $21,200 | $0 | $0 |
| 2021 | $1,380 | $16,300 | $0 | $0 |
| 2020 | $1,365 | $16,000 | $0 | $0 |
| 2019 | $1,098 | $13,400 | $0 | $0 |
| 2018 | $1,095 | $11,100 | $0 | $0 |
| 2017 | $184 | $10,700 | $0 | $0 |
| 2016 | $1,094 | $19,100 | $0 | $0 |
| 2015 | $1,130 | $11,300 | $0 | $0 |
| 2013 | $1,582 | $15,816 | $0 | $0 |
| 2010 | -- | $20,974 | $799 | $20,175 |
Source: Public Records
Map
Nearby Homes
- 20145 Kentucky St
- 20043 Wyoming Ave
- 19958 Washburn St
- 19936 Washburn St
- 20030 Ohio St
- 8817 Pembroke Ave
- 8655 Pembroke Ave
- 20134 Griggs St
- 20451 Kentucky St
- 20401 Washburn St
- 20436 Washburn St
- 20145 Northlawn St
- 20484 Wisconsin St
- 20111 Roselawn St
- 20504 Cherrylawn St
- 19439 Wyoming Ave
- 20501 Northlawn St
- 20045 Greenlawn St
- 19442 Ilene St
- 20022 Pinehurst St
- 20135 Kentucky St
- 20121 Kentucky St
- 20103 Kentucky St
- 20128 Wyoming St
- 20136 Wyoming St
- 20120 Wyoming St
- 20142 Wyoming St
- 20151 Kentucky St
- 20112 Wyoming St
- 20132 Kentucky St
- 20157 Kentucky St
- 20120 Kentucky St
- 20154 Wyoming St
- 20142 Kentucky St
- 20100 Wyoming St
- 20110 Kentucky St
- 20150 Kentucky St
- 20167 Kentucky St
- 20104 Kentucky St
- 20160 Wyoming St