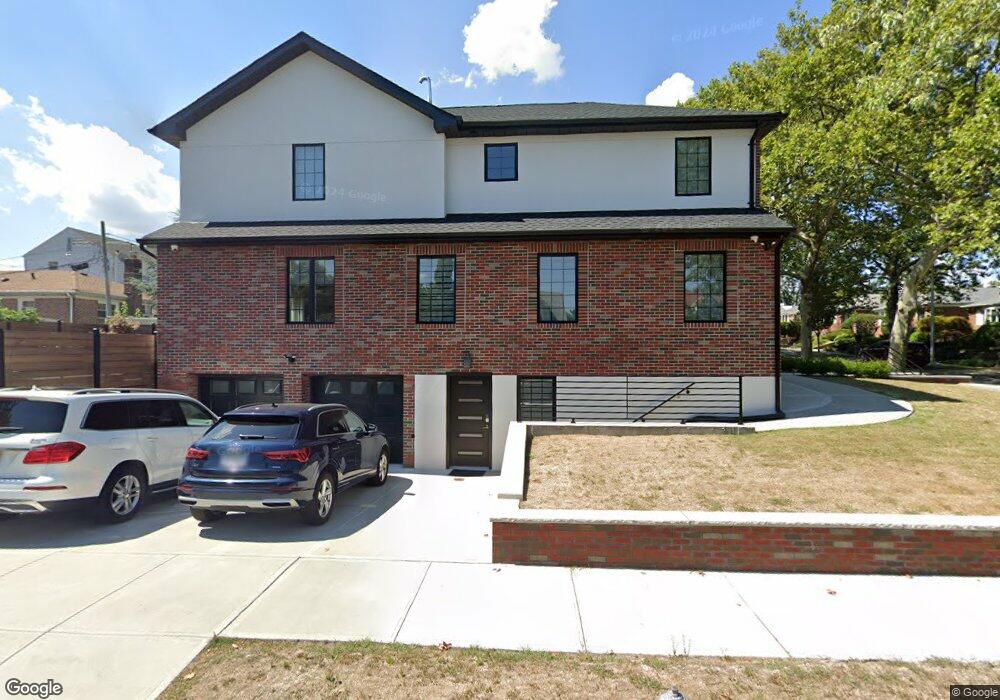
20128 24th Rd Bayside, NY 11360
Clearview NeighborhoodEstimated Value: $1,505,000 - $1,811,000
Studio
--
Bath
2,243
Sq Ft
$730/Sq Ft
Est. Value
About This Home
This home is located at 20128 24th Rd, Bayside, NY 11360 and is currently estimated at $1,637,734, approximately $730 per square foot. 20128 24th Rd is a home located in Queens County with nearby schools including P.S. 184 Flushing Manor, I.S. 25 Adrien Block, and Bayside High School.
Ownership History
Date
Name
Owned For
Owner Type
Purchase Details
Closed on
Dec 15, 2020
Sold by
Beis Konstantinos
Bought by
Chang Jian and Zhu Shu Jun
Current Estimated Value
Home Financials for this Owner
Home Financials are based on the most recent Mortgage that was taken out on this home.
Original Mortgage
$900,000
Outstanding Balance
$801,268
Interest Rate
2.7%
Mortgage Type
Purchase Money Mortgage
Estimated Equity
$836,466
Purchase Details
Closed on
Mar 21, 2019
Sold by
Lattuca Carolyn M and Lattuca Dominick R
Bought by
Beis Konstantinos
Home Financials for this Owner
Home Financials are based on the most recent Mortgage that was taken out on this home.
Original Mortgage
$500,000
Interest Rate
4.3%
Mortgage Type
Purchase Money Mortgage
Purchase Details
Closed on
Oct 8, 2002
Sold by
Lattuca John and Lattuca Marie
Bought by
Lattuca Carolyn M and Lattuca Dominick R
Create a Home Valuation Report for This Property
The Home Valuation Report is an in-depth analysis detailing your home's value as well as a comparison with similar homes in the area
Home Values in the Area
Average Home Value in this Area
Purchase History
| Date | Buyer | Sale Price | Title Company |
|---|---|---|---|
| Chang Jian | $1,480,000 | -- | |
| Beis Konstantinos | $750,000 | -- | |
| Lattuca Carolyn M | -- | -- |
Source: Public Records
Mortgage History
| Date | Status | Borrower | Loan Amount |
|---|---|---|---|
| Open | Chang Jian | $900,000 | |
| Previous Owner | Beis Konstantinos | $500,000 |
Source: Public Records
Tax History
| Year | Tax Paid | Tax Assessment Tax Assessment Total Assessment is a certain percentage of the fair market value that is determined by local assessors to be the total taxable value of land and additions on the property. | Land | Improvement |
|---|---|---|---|---|
| 2025 | $11,862 | $62,094 | $17,244 | $44,850 |
| 2024 | $11,862 | $59,057 | $17,662 | $41,395 |
| 2023 | $11,286 | $56,191 | $16,673 | $39,518 |
| 2022 | $11,412 | $80,280 | $24,960 | $55,320 |
| 2021 | $9,978 | $59,700 | $12,180 | $47,520 |
| 2020 | $9,468 | $58,560 | $12,180 | $46,380 |
| 2019 | $8,828 | $57,300 | $12,180 | $45,120 |
| 2018 | $8,116 | $39,812 | $10,733 | $29,079 |
| 2017 | $7,515 | $39,812 | $11,011 | $28,801 |
| 2016 | $6,694 | $39,812 | $11,011 | $28,801 |
| 2015 | $3,749 | $37,276 | $12,018 | $25,258 |
| 2014 | $3,749 | $35,167 | $12,798 | $22,369 |
Source: Public Records
Map
Nearby Homes
- 20124 24th Ave
- 200-33 26th Ave
- 199-27 26th Ave
- 201-05 28th Ave
- 2801 206th St
- 21-47 Utopia Pkwy Unit 2
- 21-29 Utopia Pkwy Unit UPSTAIRS
- 19916 21st Ave Unit 1336
- 28-07 172nd St
- 2615 Clearview Expy
- 199-15 21 Ave Unit 1-356
- 199-05 21st Ave Unit 1st Floor
- 20-19 Utopia Pkwy Unit 1-371
- 16662 22nd Ave
- 2318 A Corporal Kennedy St Unit 95
- 2533 Francis Lewis Blvd
- 201-02 19th Ave Unit 2-142
- 23-18 Corporal Kennedy St Unit A
- 166-36 23rd Ave
- 199-18 19th Ave Unit 18
Your Personal Tour Guide
Ask me questions while you tour the home.