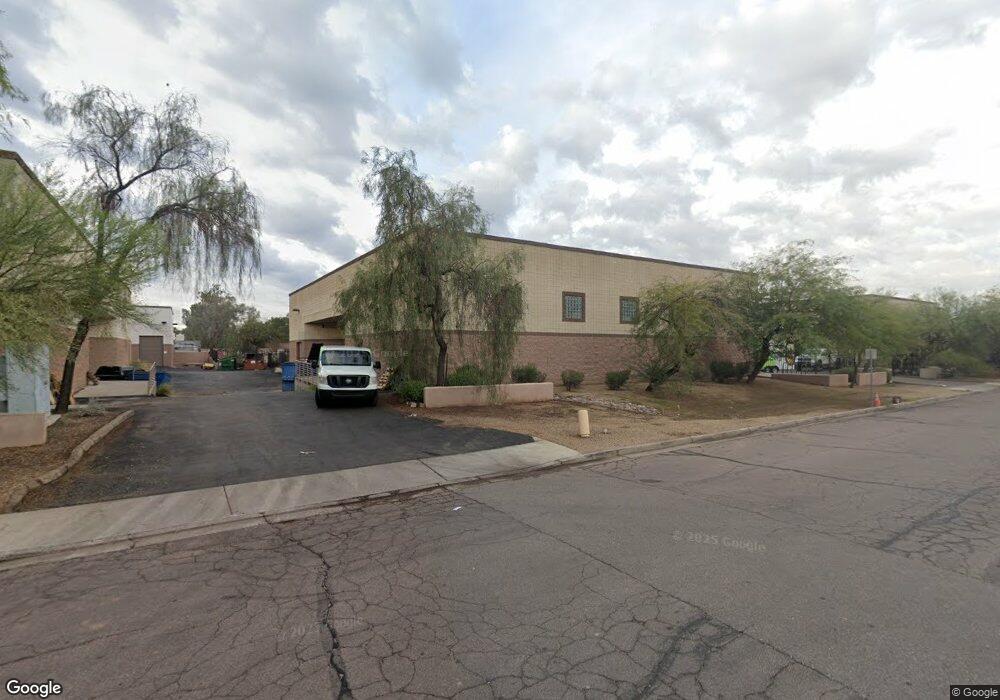
2013 E Cedar St Tempe, AZ 85281
Apache NeighborhoodEstimated Value: $1,779,593
Studio
--
Bath
9,788
Sq Ft
$182/Sq Ft
Est. Value
About This Home
This home is located at 2013 E Cedar St, Tempe, AZ 85281 and is currently estimated at $1,779,593, approximately $181 per square foot. 2013 E Cedar St is a home located in Maricopa County with nearby schools including Curry Elementary School, Connolly Middle School, and McClintock High School.
Ownership History
Date
Name
Owned For
Owner Type
Purchase Details
Closed on
Sep 6, 2021
Sold by
Baby Ruth Llc
Bought by
Baby Ruth Llc
Current Estimated Value
Home Financials for this Owner
Home Financials are based on the most recent Mortgage that was taken out on this home.
Original Mortgage
$240,000
Outstanding Balance
$219,308
Interest Rate
3.09%
Mortgage Type
Future Advance Clause Open End Mortgage
Estimated Equity
$1,560,285
Purchase Details
Closed on
Jul 27, 2004
Sold by
Jsb Cedar Street Llc
Bought by
Salem Jean
Home Financials for this Owner
Home Financials are based on the most recent Mortgage that was taken out on this home.
Original Mortgage
$548,000
Interest Rate
6.24%
Mortgage Type
Commercial
Purchase Details
Closed on
Aug 8, 2001
Sold by
Brouwer Johannes
Bought by
Jsb Cedar Street Llc
Purchase Details
Closed on
Aug 21, 1997
Sold by
The Dutch Investment Group Inc
Bought by
Brouwer Johannes
Create a Home Valuation Report for This Property
The Home Valuation Report is an in-depth analysis detailing your home's value as well as a comparison with similar homes in the area
Home Values in the Area
Average Home Value in this Area
Purchase History
| Date | Buyer | Sale Price | Title Company |
|---|---|---|---|
| Baby Ruth Llc | -- | Driggs Title Agency Inc | |
| Salem Jean | $685,000 | Fidelity National Title | |
| Jsb Cedar Street Llc | -- | -- | |
| Brouwer Johannes | $120,000 | Nations Title Insurance |
Source: Public Records
Mortgage History
| Date | Status | Borrower | Loan Amount |
|---|---|---|---|
| Open | Baby Ruth Llc | $240,000 | |
| Previous Owner | Salem Jean | $548,000 |
Source: Public Records
Tax History
| Year | Tax Paid | Tax Assessment Tax Assessment Total Assessment is a certain percentage of the fair market value that is determined by local assessors to be the total taxable value of land and additions on the property. | Land | Improvement |
|---|---|---|---|---|
| 2025 | $15,462 | $129,001 | -- | -- |
| 2024 | $15,168 | $126,697 | -- | -- |
| 2023 | $15,168 | $197,574 | $112,285 | $85,289 |
| 2022 | $14,978 | $177,223 | $80,920 | $96,303 |
| 2021 | $15,512 | $173,808 | $83,232 | $90,576 |
| 2020 | $15,041 | $162,018 | $66,762 | $95,256 |
| 2019 | $14,756 | $148,968 | $65,700 | $83,268 |
| 2018 | $14,390 | $134,352 | $47,196 | $87,156 |
| 2017 | $13,961 | $127,080 | $43,596 | $83,484 |
| 2016 | $13,863 | $115,830 | $37,908 | $77,922 |
Source: Public Records
Map
Nearby Homes
- 1512 S River Dr
- 1527 S River Dr
- 2151 E Sanos Dr
- 1832 S River Dr
- 2134 E Broadway Rd Unit 1039
- 2134 E Broadway Rd Unit 1035
- 1224 S Smith Rd
- 2136 E Lemon St
- 2009 E Don Carlos Ave
- 1986 E Palmcroft Dr
- 2045 E Orange St
- 2057 E Orange St
- 2026 E Orange St
- 2132 E Broadmor Dr
- 2050 E 10th St
- 1886 E Don Carlos Ave Unit 170
- 2127 E 10th St Unit 4
- 2123 E Kirkland Ln Unit 4
- 2129 E Kirkland Ln Unit 1
- 2122 E Kirkland Ln Unit 3
- 1500 S River Dr
- 1502 S River Dr
- 1499 S River Dr
- 1506 S River Dr
- 1501 S River Dr
- 1505 S River Dr
- 1516 S River Dr
- 1815 S River Dr
- 1511 S River Dr
- 1522 S River Dr
- 1526 S River Dr
- 1515 S River Dr
- 1517 S River Dr
- 1530 S River Dr
- 1521 S River Dr
- 1525 S River Dr
- 1536 S River Dr
- 2040 E Wildermuth Ave
- 2026 E Wildermuth Ave
- 1529 S River Dr
Your Personal Tour Guide
Ask me questions while you tour the home.