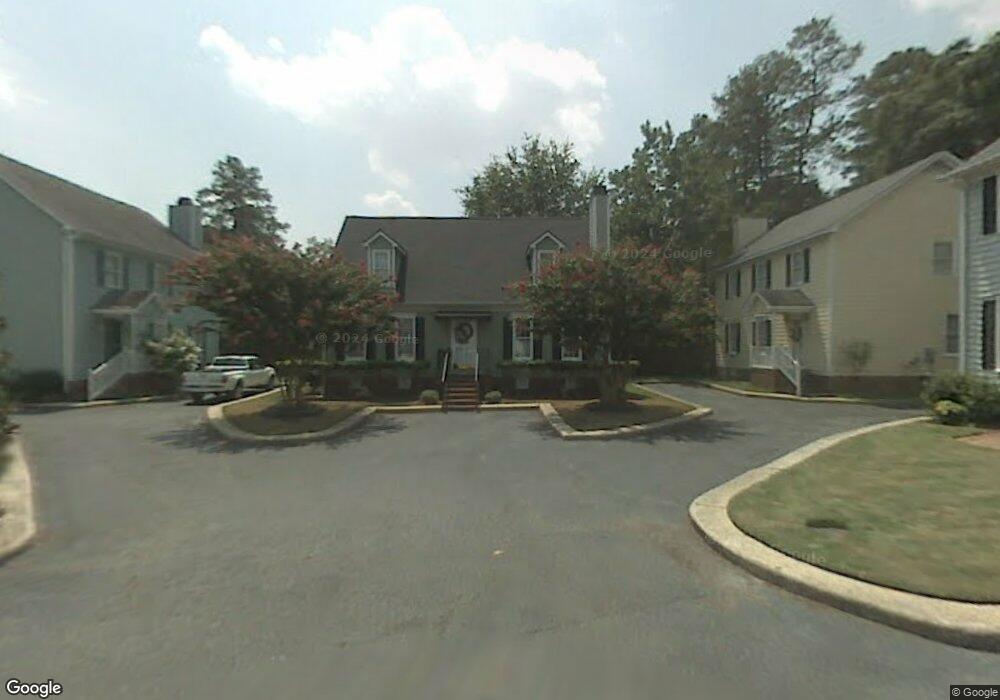
2013 Fig Ct Fayetteville, NC 28305
Terry Sanford NeighborhoodEstimated Value: $266,000 - $330,000
4
Beds
3
Baths
1,844
Sq Ft
$162/Sq Ft
Est. Value
About This Home
This home is located at 2013 Fig Ct, Fayetteville, NC 28305 and is currently estimated at $299,042, approximately $162 per square foot. 2013 Fig Ct is a home located in Cumberland County with nearby schools including Alma O Easom Elementary, Vanstory Hills Elementary School, and R. Max Abbott Middle School.
Ownership History
Date
Name
Owned For
Owner Type
Purchase Details
Closed on
Aug 31, 2004
Sold by
Benton Lance
Bought by
Sweers Shelley
Current Estimated Value
Home Financials for this Owner
Home Financials are based on the most recent Mortgage that was taken out on this home.
Original Mortgage
$100,000
Outstanding Balance
$49,840
Interest Rate
5.97%
Mortgage Type
New Conventional
Estimated Equity
$249,202
Purchase Details
Closed on
Nov 27, 2002
Sold by
Smith Lynda D
Bought by
Benton Lance S
Purchase Details
Closed on
Apr 12, 2001
Sold by
Cornwell Michael S
Bought by
Smith Lynda D
Home Financials for this Owner
Home Financials are based on the most recent Mortgage that was taken out on this home.
Original Mortgage
$110,000
Interest Rate
7.01%
Create a Home Valuation Report for This Property
The Home Valuation Report is an in-depth analysis detailing your home's value as well as a comparison with similar homes in the area
Home Values in the Area
Average Home Value in this Area
Purchase History
| Date | Buyer | Sale Price | Title Company |
|---|---|---|---|
| Sweers Shelley | $150,000 | -- | |
| Benton Lance S | $130,000 | -- | |
| Smith Lynda D | $117,000 | -- |
Source: Public Records
Mortgage History
| Date | Status | Borrower | Loan Amount |
|---|---|---|---|
| Open | Sweers Shelley | $100,000 | |
| Previous Owner | Smith Lynda D | $110,000 |
Source: Public Records
Tax History Compared to Growth
Tax History
| Year | Tax Paid | Tax Assessment Tax Assessment Total Assessment is a certain percentage of the fair market value that is determined by local assessors to be the total taxable value of land and additions on the property. | Land | Improvement |
|---|---|---|---|---|
| 2024 | $3,036 | $163,445 | $40,000 | $123,445 |
| 2023 | $2,608 | $163,445 | $40,000 | $123,445 |
| 2022 | $2,466 | $163,445 | $40,000 | $123,445 |
| 2021 | $2,466 | $163,445 | $40,000 | $123,445 |
| 2019 | $2,431 | $162,700 | $40,000 | $122,700 |
| 2018 | $2,431 | $162,700 | $40,000 | $122,700 |
| 2017 | $2,328 | $162,700 | $40,000 | $122,700 |
| 2016 | $2,392 | $181,900 | $40,000 | $141,900 |
| 2015 | $2,367 | $181,900 | $40,000 | $141,900 |
| 2014 | $2,360 | $181,900 | $40,000 | $141,900 |
Source: Public Records
Map
Nearby Homes