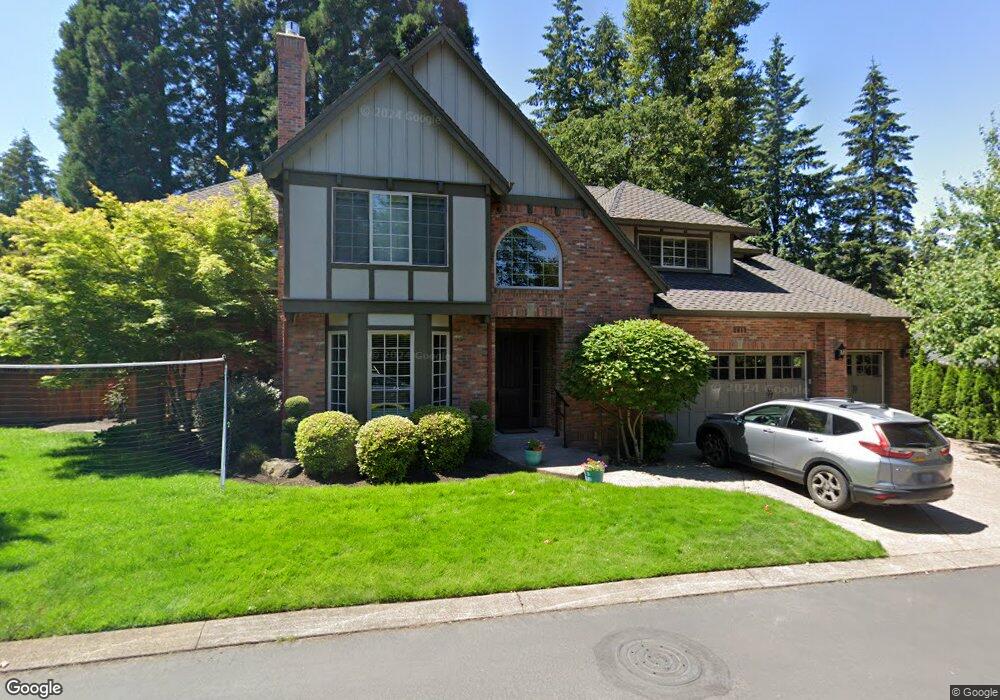
2013 Mountain View Ct West Linn, OR 97068
Marylhurst NeighborhoodEstimated Value: $1,111,000 - $1,426,000
4
Beds
4
Baths
4,107
Sq Ft
$312/Sq Ft
Est. Value
About This Home
This home is located at 2013 Mountain View Ct, West Linn, OR 97068 and is currently estimated at $1,282,435, approximately $312 per square foot. 2013 Mountain View Ct is a home located in Clackamas County with nearby schools including Stafford Primary School, West Linn High School, and Harmony Academy.
Ownership History
Date
Name
Owned For
Owner Type
Purchase Details
Closed on
Jun 3, 2014
Sold by
Edwards Group Llc
Bought by
Koch Paul A and Koch Kelli R
Current Estimated Value
Home Financials for this Owner
Home Financials are based on the most recent Mortgage that was taken out on this home.
Original Mortgage
$115,000
Outstanding Balance
$33,493
Interest Rate
3.26%
Mortgage Type
Stand Alone Second
Estimated Equity
$1,248,942
Purchase Details
Closed on
Oct 24, 2013
Sold by
Webb Sarah J
Bought by
Edwards Group Llc
Purchase Details
Closed on
Aug 11, 2009
Sold by
Centurion Homes Inc
Bought by
Webb Kevin M and Webb Sarah J
Home Financials for this Owner
Home Financials are based on the most recent Mortgage that was taken out on this home.
Original Mortgage
$200,000
Interest Rate
5.3%
Mortgage Type
Purchase Money Mortgage
Create a Home Valuation Report for This Property
The Home Valuation Report is an in-depth analysis detailing your home's value as well as a comparison with similar homes in the area
Home Values in the Area
Average Home Value in this Area
Purchase History
| Date | Buyer | Sale Price | Title Company |
|---|---|---|---|
| Koch Paul A | $705,000 | Ticor Title | |
| Edwards Group Llc | -- | Ticor Title | |
| Webb Kevin M | $735,000 | Chicago Title Insurance Co |
Source: Public Records
Mortgage History
| Date | Status | Borrower | Loan Amount |
|---|---|---|---|
| Open | Koch Paul A | $115,000 | |
| Open | Koch Paul A | $417,000 | |
| Previous Owner | Webb Kevin M | $200,000 |
Source: Public Records
Tax History Compared to Growth
Tax History
| Year | Tax Paid | Tax Assessment Tax Assessment Total Assessment is a certain percentage of the fair market value that is determined by local assessors to be the total taxable value of land and additions on the property. | Land | Improvement |
|---|---|---|---|---|
| 2025 | $15,955 | $827,920 | -- | -- |
| 2024 | $15,358 | $803,806 | -- | -- |
| 2023 | $15,358 | $780,395 | $0 | $0 |
| 2022 | $14,496 | $757,666 | $0 | $0 |
| 2021 | $13,761 | $735,599 | $0 | $0 |
| 2020 | $13,837 | $714,174 | $0 | $0 |
| 2019 | $13,212 | $693,373 | $0 | $0 |
| 2018 | $12,622 | $673,178 | $0 | $0 |
| 2017 | $12,132 | $653,571 | $0 | $0 |
| 2016 | $11,681 | $634,535 | $0 | $0 |
| 2015 | $11,149 | $616,053 | $0 | $0 |
| 2014 | $10,536 | $598,110 | $0 | $0 |
Source: Public Records
Map
Nearby Homes
- 1397 Skye Pkwy
- 2167 Marylwood Ct
- 1611 Arran Ct
- 1384 Celtic Ct
- 1354 Skye Pkwy
- 2041 Marylhurst Dr
- 17911 Hillside Dr
- 1321 Troon Dr
- 2455 College Hill Place
- 1777 Skyland Dr
- 2090 Valley View Dr
- 17833 Marylcreek Dr
- 18004 Eastridge Ln
- 17514 Brookhurst Dr
- 17634 Brookhurst Dr
- 17623 Brookhurst Dr
- 19661 Sun Cir
- 19655 Sun Cir
- 2636 Maria Ct
- 18194 Shady Hollow Way
- 1597 Skye (Relisted)
- 2001 Mountain View Ct
- 2027 Mountain View Ct Unit 8
- 2027 Mountain View Ct
- 1597 Skye Pkwy
- 2043 Mountain View Ct
- 2039 Mountain View Ct
- 2039 Mountain View Ct Unit 7
- 1595 Skye Pkwy
- 1593 Skye Pkwy
- 1593 Skye Pw
- 2051 Mountain View Ct
- 2067 Mountain View Ct Unit 6
- 0 Mountain View Ct
- 1591 Skye Pkwy
- 1598 Skye Pkwy
- 2083 Mountain View Ct
- 1653 Skye Pkwy
- 1596 Skye Pkwy
- 2075 Marylwood Ct