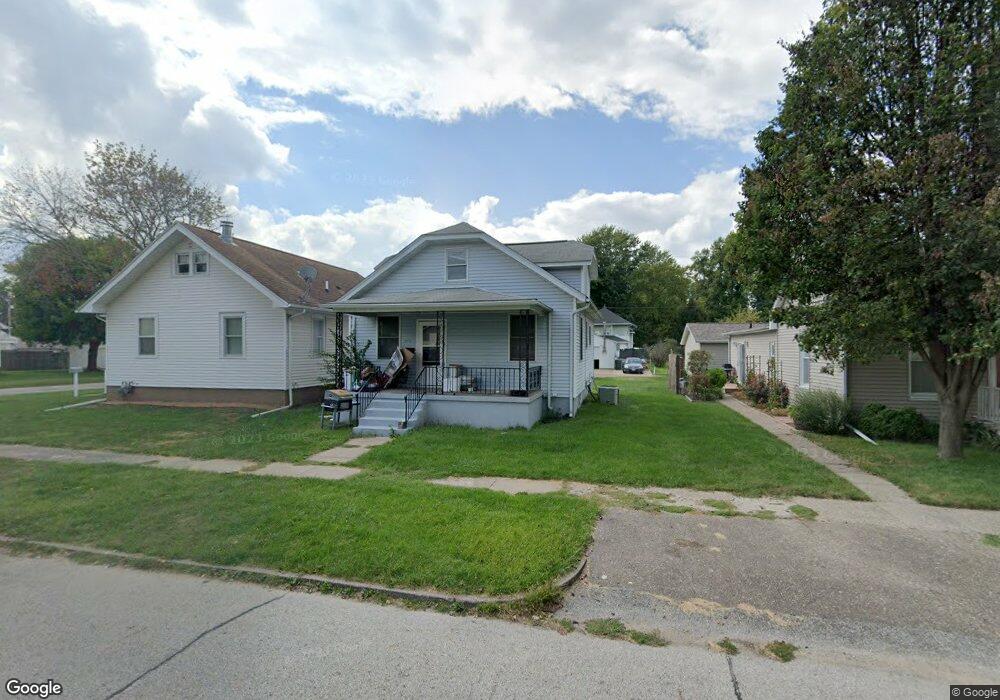
2013 S 16th St Burlington, IA 52601
Estimated Value: $76,000 - $108,000
3
Beds
2
Baths
984
Sq Ft
$89/Sq Ft
Est. Value
About This Home
This home is located at 2013 S 16th St, Burlington, IA 52601 and is currently estimated at $87,450, approximately $88 per square foot. 2013 S 16th St is a home located in Des Moines County with nearby schools including Burlington Community High School, Great River Christian School, and Burlington Notre Dame Catholic Elementary School.
Ownership History
Date
Name
Owned For
Owner Type
Purchase Details
Closed on
Jul 23, 2024
Sold by
Box Ashley Mane
Bought by
Box Zachary
Current Estimated Value
Purchase Details
Closed on
Nov 28, 2023
Sold by
Edward J Box Living Trust and Box Edward J
Bought by
Box Zachary and Box Ashley
Purchase Details
Closed on
Nov 24, 2019
Sold by
Edward J Lt
Bought by
Box Ashley and Box Zachary
Purchase Details
Closed on
Jul 28, 2017
Sold by
Kienast John A and Kienast Kimberly D
Bought by
Box Edward J and Box Sally R
Purchase Details
Closed on
May 13, 2013
Sold by
Housman Gary L
Bought by
Klein Amy
Home Financials for this Owner
Home Financials are based on the most recent Mortgage that was taken out on this home.
Original Mortgage
$85,000
Interest Rate
3.39%
Mortgage Type
New Conventional
Purchase Details
Closed on
Dec 5, 2005
Sold by
Robertson Lela B
Bought by
Brown Steven B and Brown Vicky L
Create a Home Valuation Report for This Property
The Home Valuation Report is an in-depth analysis detailing your home's value as well as a comparison with similar homes in the area
Home Values in the Area
Average Home Value in this Area
Purchase History
| Date | Buyer | Sale Price | Title Company |
|---|---|---|---|
| Box Zachary | -- | None Listed On Document | |
| Box Zachary | $54,000 | None Listed On Document | |
| Box Ashley | $54,000 | -- | |
| Box Edward J | $58,500 | None Available | |
| Klein Amy | $85,000 | None Available | |
| Brown Steven B | -- | None Available |
Source: Public Records
Mortgage History
| Date | Status | Borrower | Loan Amount |
|---|---|---|---|
| Previous Owner | Klein Amy | $85,000 |
Source: Public Records
Tax History Compared to Growth
Tax History
| Year | Tax Paid | Tax Assessment Tax Assessment Total Assessment is a certain percentage of the fair market value that is determined by local assessors to be the total taxable value of land and additions on the property. | Land | Improvement |
|---|---|---|---|---|
| 2025 | $978 | $64,400 | $7,600 | $56,800 |
| 2024 | $978 | $60,600 | $7,600 | $53,000 |
| 2023 | $852 | $60,600 | $7,600 | $53,000 |
| 2022 | $906 | $53,500 | $7,600 | $45,900 |
| 2021 | $906 | $53,500 | $7,600 | $45,900 |
| 2020 | $1,162 | $53,500 | $7,600 | $45,900 |
| 2019 | $1,386 | $53,500 | $7,600 | $45,900 |
| 2018 | $1,388 | $60,200 | $7,600 | $52,600 |
| 2017 | $1,194 | $59,200 | $0 | $0 |
| 2016 | $1,150 | $59,200 | $0 | $0 |
| 2015 | $1,150 | $59,200 | $0 | $0 |
| 2014 | $1,164 | $58,400 | $0 | $0 |
Source: Public Records
Map
Nearby Homes
- 1913 S 15th St
- 2119 Summer St
- 1912 Whittier St
- 1821 Summer St
- 2213 Cherokee St
- 1904 Delmar St
- 1704 Olive St
- 1315 Acres St
- 1902 S 10th St
- 1801 Page St
- 1605 S Central Ave
- 831 Hedge Ave
- 1407 Perkins Ave
- 1310 Summer St
- 0 155th St
- 1302 S 14th St
- 1728 Dodge St
- 1506 S 10th St
- 1301 Perkins Ave
- 801 Denmark St