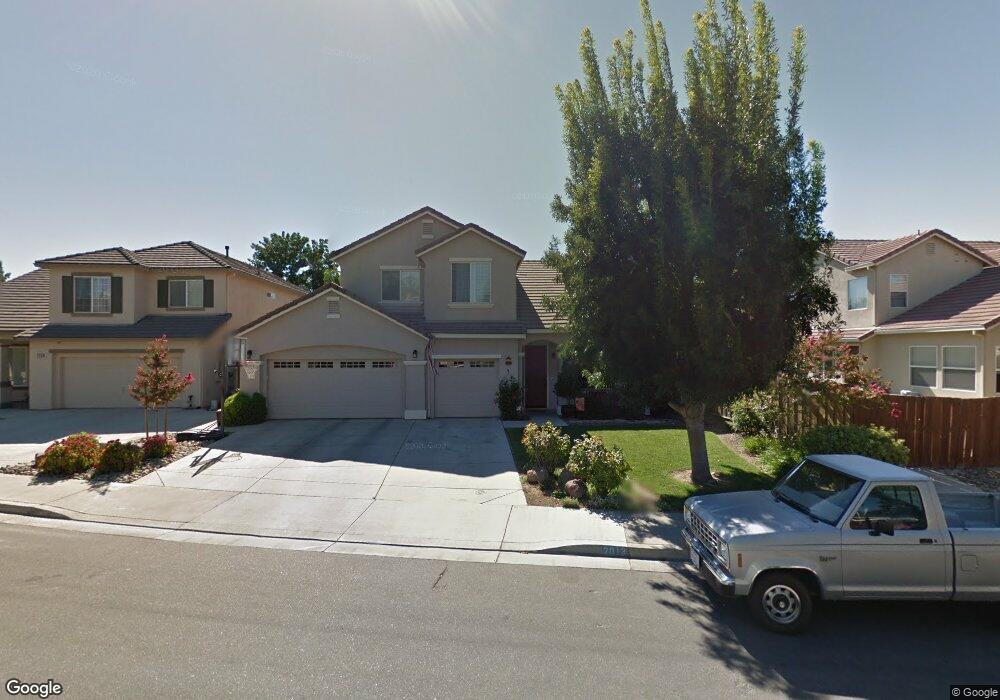
2013 Stoneglen Dr Newman, CA 95360
Estimated Value: $445,000 - $540,000
4
Beds
3
Baths
2,261
Sq Ft
$221/Sq Ft
Est. Value
About This Home
This home is located at 2013 Stoneglen Dr, Newman, CA 95360 and is currently estimated at $498,918, approximately $220 per square foot. 2013 Stoneglen Dr is a home located in Stanislaus County with nearby schools including Orestimba High School.
Ownership History
Date
Name
Owned For
Owner Type
Purchase Details
Closed on
Aug 4, 2020
Sold by
Fantazia Sharon M and Schmidt Sharon M
Bought by
Arnold Donavan M and Fantazia Sharon M
Current Estimated Value
Purchase Details
Closed on
Aug 26, 2013
Sold by
Schmidt Sharon M and Fantazia Sharon
Bought by
Fantazia Sharon
Home Financials for this Owner
Home Financials are based on the most recent Mortgage that was taken out on this home.
Original Mortgage
$179,500
Outstanding Balance
$90,010
Interest Rate
4.36%
Mortgage Type
New Conventional
Estimated Equity
$408,908
Purchase Details
Closed on
Jun 8, 2011
Sold by
Schmidt Curtis J and Schmidt Sharon M
Bought by
Schmidt Sharon M
Purchase Details
Closed on
Feb 7, 2003
Sold by
Creekbridge Homes
Bought by
Schmidt Curtis J and Schmidt Sharon M
Home Financials for this Owner
Home Financials are based on the most recent Mortgage that was taken out on this home.
Original Mortgage
$215,643
Interest Rate
5.79%
Create a Home Valuation Report for This Property
The Home Valuation Report is an in-depth analysis detailing your home's value as well as a comparison with similar homes in the area
Home Values in the Area
Average Home Value in this Area
Purchase History
| Date | Buyer | Sale Price | Title Company |
|---|---|---|---|
| Arnold Donavan M | -- | None Available | |
| Fantazia Sharon | -- | None Available | |
| Schmidt Sharon M | -- | None Available | |
| Schmidt Curtis J | $270,000 | Chicago Title |
Source: Public Records
Mortgage History
| Date | Status | Borrower | Loan Amount |
|---|---|---|---|
| Open | Fantazia Sharon | $179,500 | |
| Previous Owner | Schmidt Curtis J | $215,643 |
Source: Public Records
Tax History
| Year | Tax Paid | Tax Assessment Tax Assessment Total Assessment is a certain percentage of the fair market value that is determined by local assessors to be the total taxable value of land and additions on the property. | Land | Improvement |
|---|---|---|---|---|
| 2025 | $4,547 | $393,151 | $86,890 | $306,261 |
| 2024 | $4,431 | $385,443 | $85,187 | $300,256 |
| 2023 | $4,307 | $377,886 | $83,517 | $294,369 |
| 2022 | $4,236 | $370,478 | $81,880 | $288,598 |
| 2021 | $4,169 | $363,215 | $80,275 | $282,940 |
| 2020 | $4,085 | $359,491 | $79,452 | $280,039 |
| 2019 | $4,102 | $352,444 | $77,895 | $274,549 |
| 2018 | $3,828 | $345,534 | $76,368 | $269,166 |
| 2017 | $3,498 | $284,500 | $70,000 | $214,500 |
| 2016 | $3,006 | $271,000 | $45,000 | $226,000 |
| 2015 | $2,813 | $242,000 | $42,000 | $200,000 |
| 2014 | $2,367 | $201,500 | $35,000 | $166,500 |
Source: Public Records
Map
Nearby Homes
- 1118 Strawbridge Dr
- 619-657 Inyo Ave
- 1938 Taylor Ave
- 1542 Corgiat Dr
- 2239 Mia Dr
- 2245 Mia Dr
- 2251 Mia Dr
- 2258 Marlene Ct
- 2269 Marlene Ct
- 2291 George Ct
- 2270 Marlene Ct
- 2265 Travis Ct
- 2287 Marlene Ct
- 2260 Travis Ct
- 2266 Travis Ct
- 2283 Travis Ct
- 2288 Marlene Ct
- 28937 Upper Rd
- 2272 Travis Ct
- 2278 Travis Ct
- 2019 Stoneglen Dr
- 1154 Strawbridge Dr
- 1160 Strawbridge Dr
- 2025 Stoneglen Dr
- 1148 Strawbridge Dr
- 2031 Stoneglen Dr
- 2012 Stoneglen Dr
- 2018 Stoneglen Dr
- 2024 Stoneglen Dr
- 1161 Strawbridge Dr
- 2030 Stoneglen Dr
- 1142 Strawbridge Dr
- 1149 Strawbridge Dr
- 2037 Stoneglen Dr
- 1149 Stoneglen Dr
- 1136 Strawbridge Dr
- 1978 Leslie Ave
- 1143 Strawbridge Dr
- 2013 Stockbridge Dr
- 2019 Stockbridge Dr
Your Personal Tour Guide
Ask me questions while you tour the home.