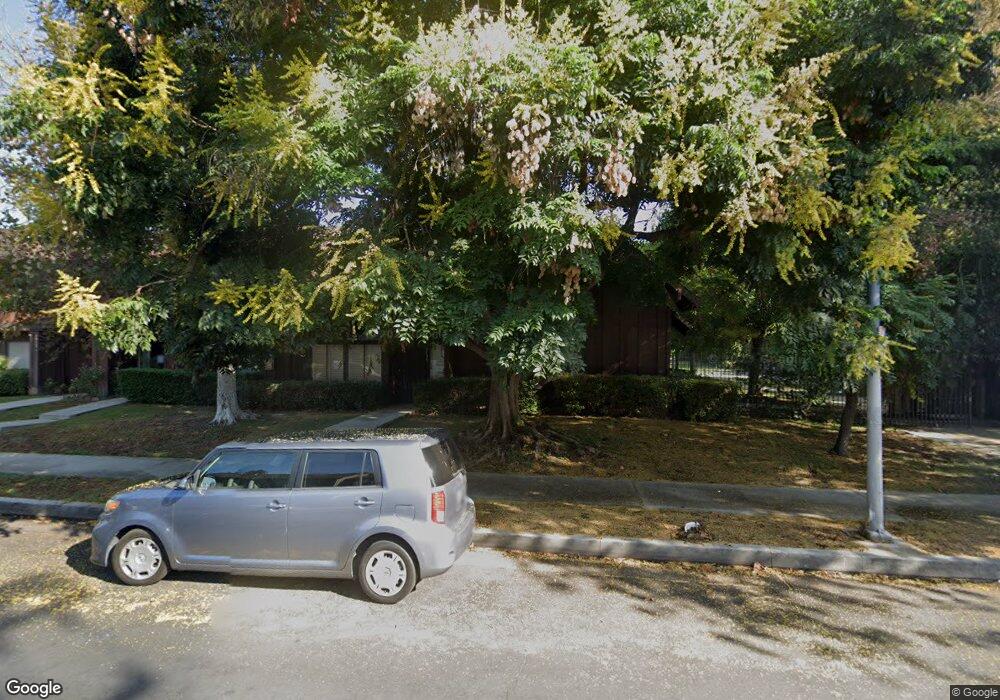
20133 Runnymede St Unit 5 Winnetka, CA 91306
Estimated Value: $597,478 - $654,000
2
Beds
3
Baths
1,585
Sq Ft
$390/Sq Ft
Est. Value
About This Home
This home is located at 20133 Runnymede St Unit 5, Winnetka, CA 91306 and is currently estimated at $617,870, approximately $389 per square foot. 20133 Runnymede St Unit 5 is a home located in Los Angeles County with nearby schools including Stanley Mosk Elementary School, John A. Sutter Middle School, and Northridge Academy High.
Ownership History
Date
Name
Owned For
Owner Type
Purchase Details
Closed on
May 29, 2019
Sold by
Ros Madeleine Cecilia Loeb Da
Bought by
Amoroso Marie Louise
Current Estimated Value
Purchase Details
Closed on
Feb 2, 2011
Sold by
Da Ros Pablo I
Bought by
Loeb Da Ros Madeleine Cecilia
Purchase Details
Closed on
Dec 15, 2009
Sold by
Loeb Altagracia and Loeb Madeleine Cecilia
Bought by
Loeb Altagracia
Purchase Details
Closed on
Jul 17, 2009
Sold by
Loeb Altagracia
Bought by
Loeb Altagracia
Purchase Details
Closed on
Feb 26, 2003
Sold by
Sorrentino Rosemary and The Rosemary T Sorrentino Fami
Bought by
Loeb Morton
Home Financials for this Owner
Home Financials are based on the most recent Mortgage that was taken out on this home.
Original Mortgage
$90,000
Interest Rate
5.79%
Create a Home Valuation Report for This Property
The Home Valuation Report is an in-depth analysis detailing your home's value as well as a comparison with similar homes in the area
Home Values in the Area
Average Home Value in this Area
Purchase History
| Date | Buyer | Sale Price | Title Company |
|---|---|---|---|
| Amoroso Marie Louise | $455,000 | Priority Title | |
| Loeb Da Ros Madeleine Cecilia | -- | None Available | |
| Loeb Da Ros Madeleine Cecilia | -- | None Available | |
| Loeb Altagracia | -- | None Available | |
| Loeb Altagracia | -- | Accommodation | |
| Loeb Morton | $240,000 | Chicago Title |
Source: Public Records
Mortgage History
| Date | Status | Borrower | Loan Amount |
|---|---|---|---|
| Previous Owner | Loeb Morton | $90,000 |
Source: Public Records
Tax History Compared to Growth
Tax History
| Year | Tax Paid | Tax Assessment Tax Assessment Total Assessment is a certain percentage of the fair market value that is determined by local assessors to be the total taxable value of land and additions on the property. | Land | Improvement |
|---|---|---|---|---|
| 2025 | $4,360 | $354,635 | $236,681 | $117,954 |
| 2024 | $4,360 | $347,683 | $232,041 | $115,642 |
| 2023 | $4,277 | $340,867 | $227,492 | $113,375 |
| 2022 | $4,080 | $334,184 | $223,032 | $111,152 |
| 2021 | $4,023 | $327,632 | $218,659 | $108,973 |
| 2019 | $3,460 | $165,688 | $58,389 | $107,299 |
| 2018 | $2,059 | $162,441 | $57,245 | $105,196 |
| 2016 | $1,950 | $156,135 | $55,023 | $101,112 |
| 2015 | $1,922 | $153,791 | $54,197 | $99,594 |
| 2014 | $1,935 | $150,780 | $53,136 | $97,644 |
Source: Public Records
Map
Nearby Homes
- 20122 Cohasset St
- 20110 Cohasset St
- 20214 Cohasset St
- 20158 Cohasset St Unit 10
- 20243 Valerio St
- 20134 Leadwell St Unit 306
- 20134 Leadwell St Unit 156
- 20134 Leadwell St Unit 217
- 20134 Leadwell St Unit 133
- 7640 Oso Ave Unit 316
- 7640 Oso Ave Unit 217
- 20235 Keswick St Unit 102
- 20155 Keswick St Unit 209
- 7400 Lubao Ave
- 20253 Keswick St Unit 326
- 20253 Keswick St Unit 105
- 20254 Stagg St
- 7539 Hatillo Ave
- 20329 Stagg St
- 20224 Sherman Way Unit 26
- 20133 Runnymede St
- 20131 Runnymede St Unit 24
- 20131 Runnymede St
- 20129 Runnymede St
- 20135 Runnymede St Unit 4
- 20127 Runnymede St Unit 26
- 20137 Runnymede St
- 20125 Runnymede St Unit 27
- 20139 Runnymede St Unit 2
- 20139 Runnymede St
- 20141 Runnymede St
- 20123 Runnymede St
- 20409 Runnymede St
- 20121 Runnymede St
- 20128 Cohasset St
- 20117 Runnymede St Unit 31
- 20117 Runnymede St
- 20115 Runnymede St Unit 32
- 20111 Runnymede St
- 20151 Runnymede St