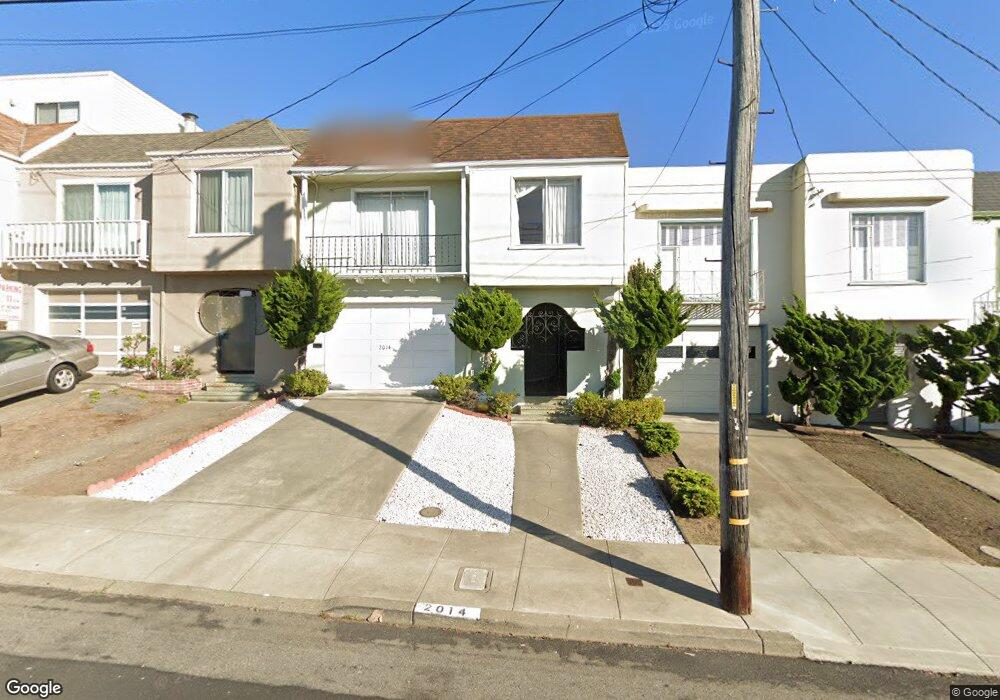
2014 34th Ave San Francisco, CA 94116
Parkside NeighborhoodEstimated Value: $1,313,000 - $1,494,000
Studio
1
Bath
1,150
Sq Ft
$1,232/Sq Ft
Est. Value
About This Home
This home is located at 2014 34th Ave, San Francisco, CA 94116 and is currently estimated at $1,416,418, approximately $1,231 per square foot. 2014 34th Ave is a home located in San Francisco County with nearby schools including Stevenson (Robert Louis) Elementary School, Giannini (A.P.) Middle School, and Holy Name Elementary School.
Ownership History
Date
Name
Owned For
Owner Type
Purchase Details
Closed on
Mar 28, 2016
Sold by
Chan Chung Wing and Chan Kwan Har Yu
Bought by
Chan Chung Wing
Current Estimated Value
Purchase Details
Closed on
Nov 18, 2002
Sold by
Bidegain Jean Pierre
Bought by
Chan Chung Wing and Chan Kwan Har Yu
Home Financials for this Owner
Home Financials are based on the most recent Mortgage that was taken out on this home.
Original Mortgage
$340,000
Interest Rate
6.12%
Mortgage Type
Stand Alone First
Create a Home Valuation Report for This Property
The Home Valuation Report is an in-depth analysis detailing your home's value as well as a comparison with similar homes in the area
Home Values in the Area
Average Home Value in this Area
Purchase History
| Date | Buyer | Sale Price | Title Company |
|---|---|---|---|
| Chan Chung Wing | -- | Servicelink | |
| Chan Chung Wing | $652,500 | Servicelink | |
| Chan Chung Wing | $520,500 | Chicago Title Co |
Source: Public Records
Mortgage History
| Date | Status | Borrower | Loan Amount |
|---|---|---|---|
| Previous Owner | Chan Chung Wing | $340,000 |
Source: Public Records
Tax History
| Year | Tax Paid | Tax Assessment Tax Assessment Total Assessment is a certain percentage of the fair market value that is determined by local assessors to be the total taxable value of land and additions on the property. | Land | Improvement |
|---|---|---|---|---|
| 2025 | $8,686 | $753,780 | $452,275 | $301,505 |
| 2024 | $8,686 | $739,003 | $443,408 | $295,595 |
| 2023 | $8,561 | $724,516 | $434,716 | $289,800 |
| 2022 | $8,408 | $710,314 | $426,194 | $284,120 |
| 2021 | $8,263 | $696,389 | $417,839 | $278,550 |
| 2020 | $8,288 | $689,252 | $413,557 | $275,695 |
| 2019 | $8,003 | $675,740 | $405,450 | $270,290 |
| 2018 | $7,734 | $662,494 | $397,501 | $264,993 |
| 2017 | $7,643 | $649,507 | $389,709 | $259,798 |
| 2016 | $7,505 | $636,784 | $382,072 | $254,712 |
| 2015 | $7,414 | $627,220 | $376,334 | $250,886 |
| 2014 | $7,218 | $614,936 | $368,964 | $245,972 |
Source: Public Records
Map
Nearby Homes
- 3327 Quintara St
- 2537 Pacheco St
- 2275 35th Ave
- 1815 29th Ave
- 2501 Moraga St
- 1671 34th Ave
- 2036 Noriega St Unit 2040
- 2824 Santiago St
- 2830 Lawton St
- 1540 36th Ave
- 2306 25th Ave
- 3833 Ortega St
- 2082 46th Ave
- 2375 24th Ave
- 1711 23rd Ave
- 2530 27th Ave
- 2401 44th Ave Unit 1
- 2514 26th Ave
- 2442 44th Ave
- 2115 20th Ave
Your Personal Tour Guide
Ask me questions while you tour the home.