
Seller's Agent in 2025
Marceen Peters
Realty ONE Group Impact
(515) 778-3014
8 in this area
206 Total Sales
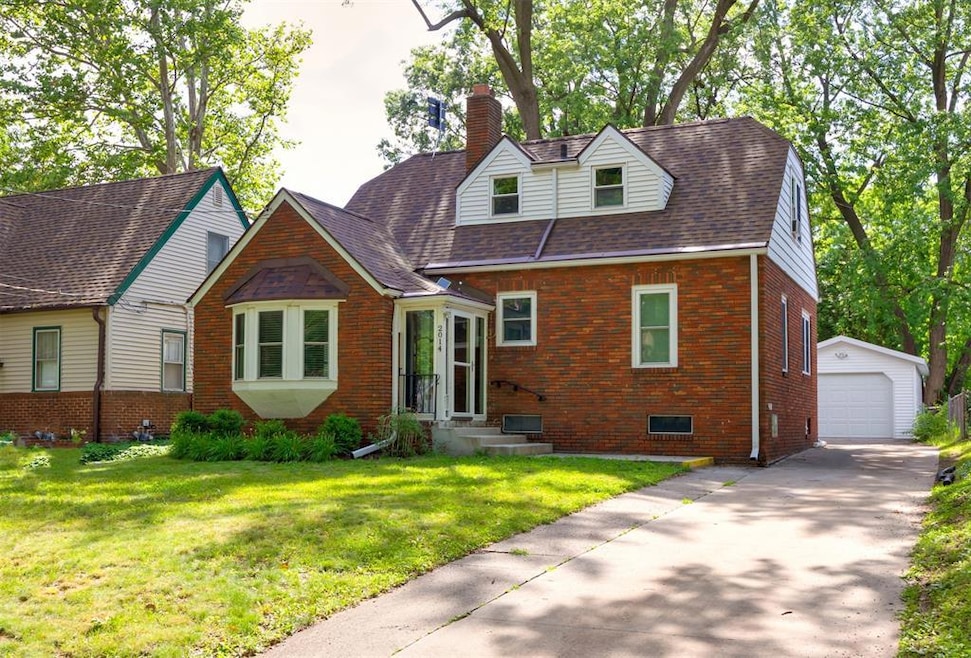
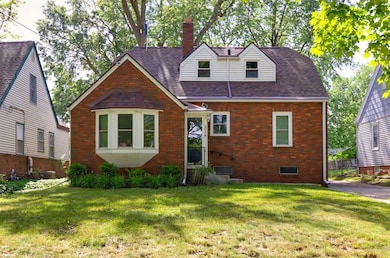
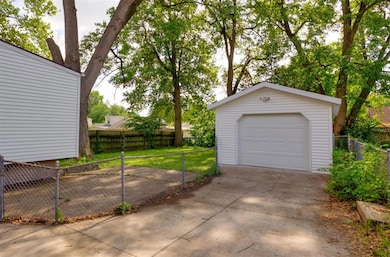
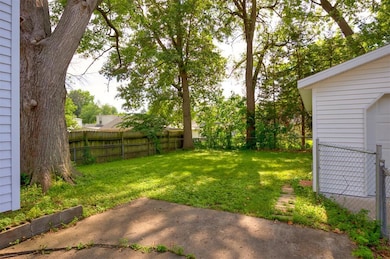
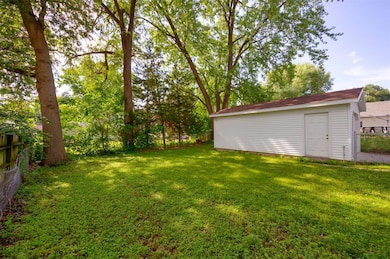
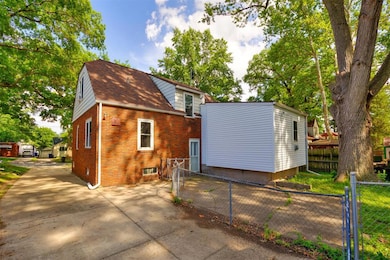
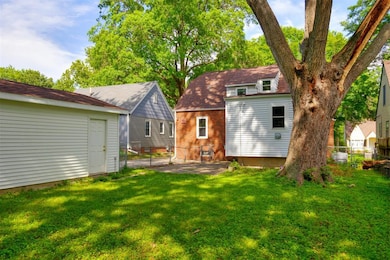
HUGE PRICE REDUCTION – MOTIVATED SELLER! Located in the heart of Beaverdale, this classic 1.5-story brick home offers 1,705 sq. ft. Major updates are already complete - newer roof, windows, furnace, & A/C, so all that’s left is your personal touch with cosmetic updates. Step inside to a spacious living room with a cozy fireplace, wood beams, and original hardwood floors that flow into the dining room. The main floor features two bedrooms, a full bath, and a large kitchen, while upstairs you'll find two more bedrooms and a convenient half bath. Outside, enjoy the fully fenced backyard, a deep one-car detached garage with extra storage or workshop space, and a newer driveway. Whether you're looking to add personal touches or invest in a great location, this Beaverdale gem is a must-see. Just minutes from local shops, parks, and restaurants! All information obtained from public and seller records.
| Date | Type | Sale Price | Title Company |
|---|---|---|---|
| Warranty Deed | $250,000 | None Listed On Document | |
| Quit Claim Deed | -- | None Listed On Document | |
| Quit Claim Deed | -- | None Listed On Document | |
| Interfamily Deed Transfer | -- | None Available |
| Date | Status | Loan Amount | Loan Type |
|---|---|---|---|
| Open | $222,700 | New Conventional | |
| Previous Owner | $130,000 | New Conventional |
| Date | Event | Price | List to Sale | Price per Sq Ft |
|---|---|---|---|---|
| 09/29/2025 09/29/25 | Sold | $250,000 | -5.6% | $147 / Sq Ft |
| 09/02/2025 09/02/25 | Pending | -- | -- | -- |
| 08/11/2025 08/11/25 | Price Changed | $264,900 | -5.1% | $155 / Sq Ft |
| 07/17/2025 07/17/25 | Price Changed | $279,000 | -3.5% | $164 / Sq Ft |
| 07/08/2025 07/08/25 | For Sale | $289,000 | -- | $170 / Sq Ft |
| Year | Tax Paid | Tax Assessment Tax Assessment Total Assessment is a certain percentage of the fair market value that is determined by local assessors to be the total taxable value of land and additions on the property. | Land | Improvement |
|---|---|---|---|---|
| 2025 | $5,058 | $309,000 | $45,600 | $263,400 |
| 2024 | $5,058 | $274,570 | $41,000 | $233,570 |
| 2023 | $5,284 | $283,200 | $41,000 | $242,200 |
| 2022 | $5,242 | $241,700 | $36,200 | $205,500 |
| 2021 | $5,102 | $241,700 | $36,200 | $205,500 |
| 2020 | $5,296 | $221,700 | $33,100 | $188,600 |
| 2019 | $4,982 | $221,700 | $33,100 | $188,600 |
| 2018 | $5,156 | $202,500 | $29,500 | $173,000 |
| 2017 | $4,632 | $202,500 | $29,500 | $173,000 |
| 2016 | $4,310 | $179,800 | $25,800 | $154,000 |
| 2015 | $4,310 | $172,300 | $25,800 | $146,500 |
| 2014 | $3,998 | $159,200 | $23,400 | $135,800 |
Seller's Agent in 2025
Marceen Peters
Realty ONE Group Impact
(515) 778-3014
8 in this area
206 Total Sales
Seller Co-Listing Agent in 2025
Renee Geurkink
Realty ONE Group Impact
(515) 494-1065
2 in this area
70 Total Sales
M
Buyer's Agent in 2025
Madison Andersen
NextHome Your Way
(515) 954-0283
1 in this area
32 Total Sales
Source: Des Moines Area Association of REALTORS®
MLS Number: 721777
APN: 100/01390-000-000
Disclaimer: Certain information contained herein is derived from information provided by parties other than Homes.com. All information provided is deemed reliable, but is not guaranteed to be accurate and should be independently verified.
![]() IDX information is provided exclusively for personal, non-commercial use, and may not be used for any purpose other than to identify prospective properties consumers may be interested in purchasing. Information is deemed reliable but not guaranteed.
IDX information is provided exclusively for personal, non-commercial use, and may not be used for any purpose other than to identify prospective properties consumers may be interested in purchasing. Information is deemed reliable but not guaranteed.