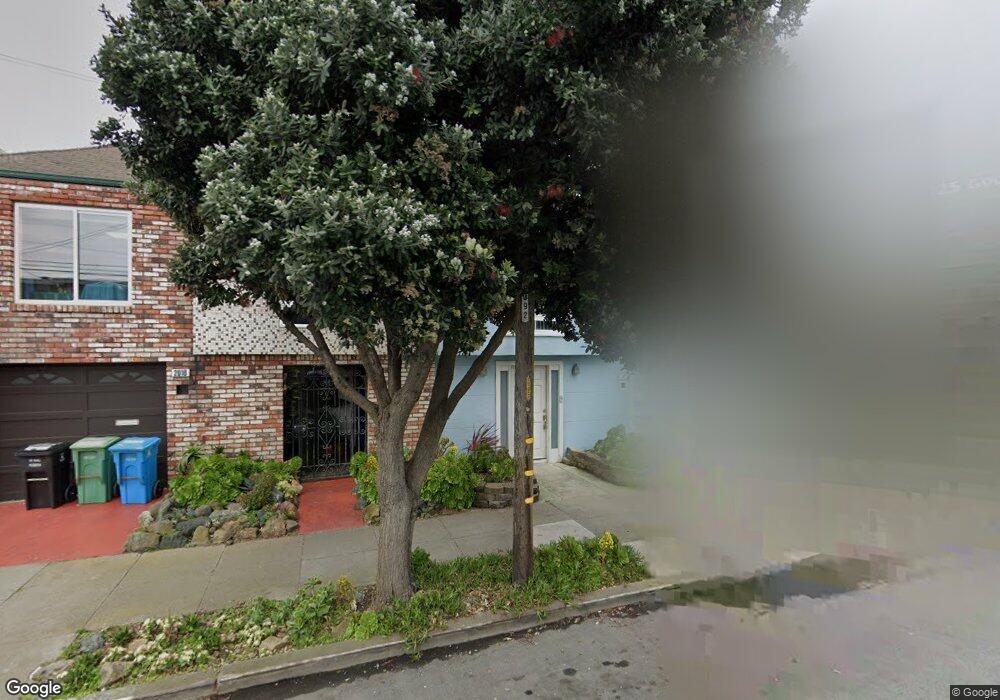
2014 48th Ave San Francisco, CA 94116
Outer Parkside NeighborhoodEstimated Value: $1,322,000 - $1,593,000
2
Beds
1
Bath
1,207
Sq Ft
$1,183/Sq Ft
Est. Value
About This Home
This home is located at 2014 48th Ave, San Francisco, CA 94116 and is currently estimated at $1,427,901, approximately $1,183 per square foot. 2014 48th Ave is a home located in San Francisco County with nearby schools including Sunset Elementary School, Giannini (A.P.) Middle School, and Holy Name Elementary School.
Ownership History
Date
Name
Owned For
Owner Type
Purchase Details
Closed on
Jun 27, 2005
Sold by
Wasley Patrick M and Wasley Penelope K
Bought by
Wasley Patrick M and Wasley Penelope K
Current Estimated Value
Purchase Details
Closed on
Sep 5, 2002
Sold by
Wasley Patrick M and Wasley Penelope K
Bought by
Wasley Patrick M and Wasley Penelope K
Home Financials for this Owner
Home Financials are based on the most recent Mortgage that was taken out on this home.
Original Mortgage
$243,400
Interest Rate
5.63%
Purchase Details
Closed on
Jul 14, 1995
Sold by
Lessig Willa F
Bought by
Wasley Patrick and Wasley Penelope
Home Financials for this Owner
Home Financials are based on the most recent Mortgage that was taken out on this home.
Original Mortgage
$186,400
Interest Rate
7.62%
Purchase Details
Closed on
Feb 3, 1995
Sold by
Rohner Margrit
Bought by
Lessig Willa F
Create a Home Valuation Report for This Property
The Home Valuation Report is an in-depth analysis detailing your home's value as well as a comparison with similar homes in the area
Home Values in the Area
Average Home Value in this Area
Purchase History
| Date | Buyer | Sale Price | Title Company |
|---|---|---|---|
| Wasley Patrick M | -- | -- | |
| Wasley Patrick M | -- | Alliance Title | |
| Wasley Patrick | $233,000 | Fidelity National Title | |
| Lessig Willa F | $60,000 | First American Title Company |
Source: Public Records
Mortgage History
| Date | Status | Borrower | Loan Amount |
|---|---|---|---|
| Closed | Wasley Patrick M | $243,400 | |
| Closed | Wasley Patrick | $186,400 |
Source: Public Records
Tax History Compared to Growth
Tax History
| Year | Tax Paid | Tax Assessment Tax Assessment Total Assessment is a certain percentage of the fair market value that is determined by local assessors to be the total taxable value of land and additions on the property. | Land | Improvement |
|---|---|---|---|---|
| 2025 | $5,152 | $387,052 | $166,113 | $220,939 |
| 2024 | $5,152 | $379,463 | $162,856 | $216,607 |
| 2023 | $5,065 | $372,023 | $159,663 | $212,360 |
| 2022 | $4,953 | $364,730 | $156,533 | $208,197 |
| 2021 | $4,859 | $357,579 | $153,464 | $204,115 |
| 2020 | $4,898 | $353,914 | $151,891 | $202,023 |
| 2019 | $4,733 | $346,975 | $148,913 | $198,062 |
| 2018 | $4,573 | $340,173 | $145,994 | $194,179 |
| 2017 | $4,219 | $333,504 | $143,132 | $190,372 |
| 2016 | $4,125 | $326,966 | $140,326 | $186,640 |
| 2015 | $4,088 | $322,056 | $138,219 | $183,837 |
| 2014 | $4,046 | $315,748 | $135,512 | $180,236 |
Source: Public Records
Map
Nearby Homes
- 2026 Great Hwy
- 3622 Rivera St
- 3917 Noriega St
- 2262 47th Ave
- 1746 47th Ave
- 2142 43rd Ave
- 2170 43rd Ave
- 4229 Moraga St
- 4108 Moraga St Unit 4110
- 2326 46th Ave
- 1645 48th Ave
- 1862 40th Ave
- 1783 40th Ave
- 1580 Great Hwy Unit 4
- 1538 48th Ave
- 1586 44th Ave
- 1563 43rd Ave
- 2278 39th Ave
- 1501-1503 46th Ave
- 1501 46th Ave