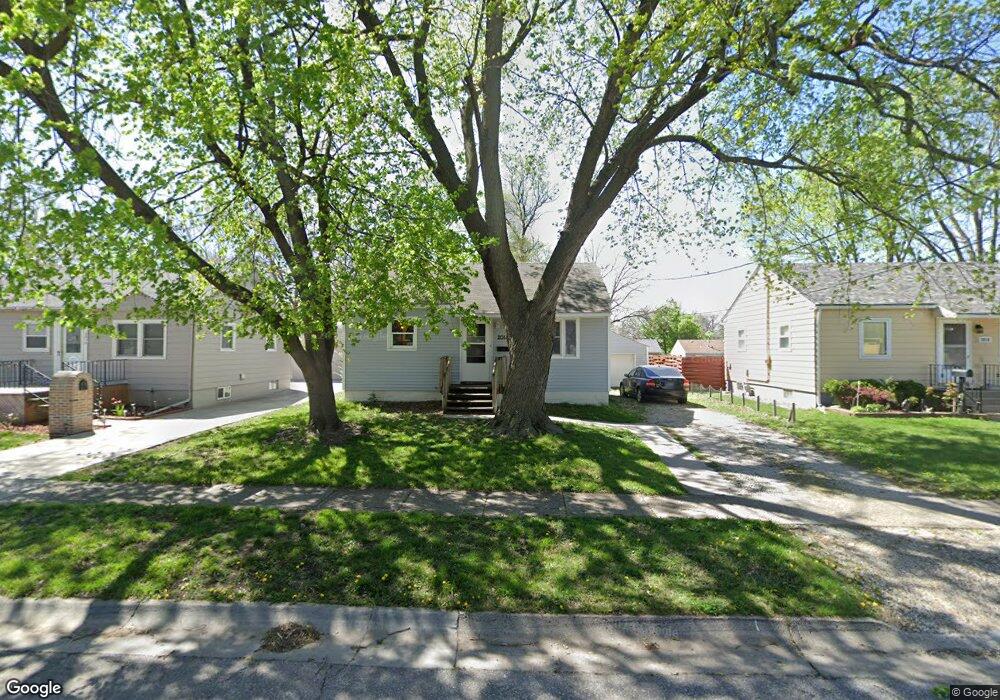
2014 60th St Des Moines, IA 50322
Merle Hay NeighborhoodEstimated Value: $143,000 - $152,187
2
Beds
1
Bath
672
Sq Ft
$221/Sq Ft
Est. Value
About This Home
This home is located at 2014 60th St, Des Moines, IA 50322 and is currently estimated at $148,297, approximately $220 per square foot. 2014 60th St is a home located in Polk County with nearby schools including Hillis Elementary School, Merrill Middle School, and Roosevelt High School.
Ownership History
Date
Name
Owned For
Owner Type
Purchase Details
Closed on
Feb 27, 2025
Sold by
Lehs Kent E and Lehs Beverly K
Bought by
Btb Investments 2 Llc
Current Estimated Value
Purchase Details
Closed on
Dec 6, 2017
Sold by
Kalny James J and James J Kalny Declaration Of T
Bought by
Lehs Kent
Purchase Details
Closed on
Nov 22, 2000
Sold by
Kalny James J
Bought by
Kalny James J
Create a Home Valuation Report for This Property
The Home Valuation Report is an in-depth analysis detailing your home's value as well as a comparison with similar homes in the area
Home Values in the Area
Average Home Value in this Area
Purchase History
| Date | Buyer | Sale Price | Title Company |
|---|---|---|---|
| Btb Investments 2 Llc | $139,500 | None Listed On Document | |
| Lehs Kent | $60,000 | None Available | |
| Kalny James J | -- | -- |
Source: Public Records
Tax History Compared to Growth
Tax History
| Year | Tax Paid | Tax Assessment Tax Assessment Total Assessment is a certain percentage of the fair market value that is determined by local assessors to be the total taxable value of land and additions on the property. | Land | Improvement |
|---|---|---|---|---|
| 2025 | $2,384 | $135,600 | $43,100 | $92,500 |
| 2024 | $2,384 | $121,200 | $38,000 | $83,200 |
| 2023 | $2,542 | $121,200 | $38,000 | $83,200 |
| 2022 | $2,524 | $107,900 | $34,300 | $73,600 |
| 2021 | $2,414 | $107,900 | $34,300 | $73,600 |
| 2020 | $2,506 | $96,700 | $30,500 | $66,200 |
| 2019 | $2,260 | $96,700 | $30,500 | $66,200 |
| 2018 | $2,238 | $84,100 | $26,700 | $57,400 |
| 2017 | $2,024 | $84,100 | $26,700 | $57,400 |
| 2016 | $1,972 | $74,800 | $23,200 | $51,600 |
| 2015 | $1,972 | $74,800 | $23,200 | $51,600 |
| 2014 | $1,766 | $69,000 | $21,100 | $47,900 |
Source: Public Records
Map
Nearby Homes