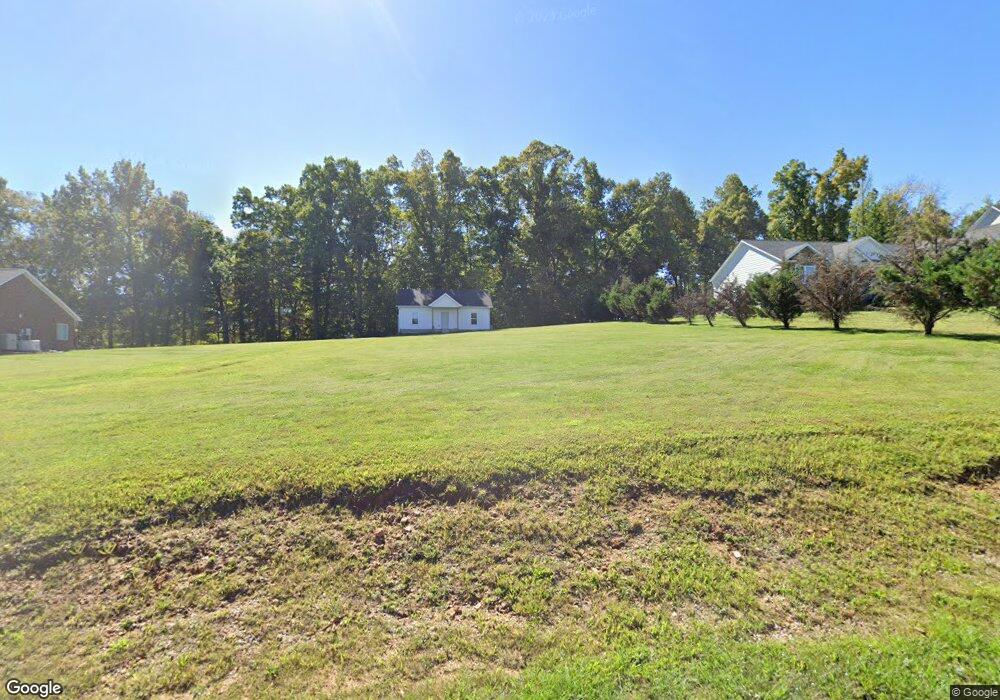
2014 Bear Creek Point Cookeville, TN 38506
Estimated Value: $287,000 - $347,000
3
Beds
2
Baths
1,410
Sq Ft
$227/Sq Ft
Est. Value
About This Home
This home is located at 2014 Bear Creek Point, Cookeville, TN 38506 and is currently estimated at $320,191, approximately $227 per square foot. 2014 Bear Creek Point is a home located in Putnam County with nearby schools including Cookeville High School, Algood Middle School, and Algood Elementary School.
Ownership History
Date
Name
Owned For
Owner Type
Purchase Details
Closed on
Sep 28, 2023
Sold by
Hull Benjamin Edward
Bought by
Wood Dylan
Current Estimated Value
Purchase Details
Closed on
May 13, 2022
Sold by
Cox Robert S and Cox Tamara S
Bought by
Hull Benjamin Edward
Purchase Details
Closed on
May 11, 2021
Sold by
Cox Robert S and Cox Tamara S
Bought by
Hull Benjamin Edward
Home Financials for this Owner
Home Financials are based on the most recent Mortgage that was taken out on this home.
Original Mortgage
$24,398
Interest Rate
3%
Mortgage Type
Commercial
Purchase Details
Closed on
May 25, 1982
Bought by
Robinson James T
Create a Home Valuation Report for This Property
The Home Valuation Report is an in-depth analysis detailing your home's value as well as a comparison with similar homes in the area
Home Values in the Area
Average Home Value in this Area
Purchase History
| Date | Buyer | Sale Price | Title Company |
|---|---|---|---|
| Wood Dylan | $35,000 | None Listed On Document | |
| Wood Dylan | $35,000 | None Listed On Document | |
| Hull Benjamin Edward | $35,000 | Cantrell Christopher | |
| Hull Benjamin Edward | $35,000 | Cantrell Christopher | |
| Hull Benjamin Edward | -- | Cantrell Christopher L | |
| Hull Benjamin Edward | -- | None Listed On Document | |
| Cox Robert | $30,497 | Integrity Title & Escrow Llc | |
| Robinson James T | -- | -- |
Source: Public Records
Mortgage History
| Date | Status | Borrower | Loan Amount |
|---|---|---|---|
| Previous Owner | Cox Robert | $24,398 |
Source: Public Records
Tax History Compared to Growth
Tax History
| Year | Tax Paid | Tax Assessment Tax Assessment Total Assessment is a certain percentage of the fair market value that is determined by local assessors to be the total taxable value of land and additions on the property. | Land | Improvement |
|---|---|---|---|---|
| 2024 | $1,051 | $39,525 | $7,250 | $32,275 |
| 2023 | $193 | $7,250 | $7,250 | $0 |
| 2022 | $179 | $7,250 | $7,250 | $0 |
| 2021 | $179 | $7,250 | $7,250 | $0 |
| 2020 | $181 | $7,250 | $7,250 | $0 |
| 2019 | $181 | $6,175 | $6,175 | $0 |
| 2018 | $169 | $6,175 | $6,175 | $0 |
| 2017 | $169 | $6,175 | $6,175 | $0 |
| 2016 | $169 | $6,175 | $6,175 | $0 |
| 2015 | $203 | $7,250 | $7,250 | $0 |
| 2014 | $188 | $6,706 | $0 | $0 |
Source: Public Records
Map
Nearby Homes
- 2035 Bear Creek Point
- 1916 Bear Creek Point
- 3435 Northwind Dr
- 0 Bear Creek Cir
- 3429 Wj Robinson Rd
- 1663 Paran Rd
- 902 Evelyn Ct
- 3011 Zeb Warren Rd
- 5004 Curtis Way
- 1081 Cynthia St
- 5898 Hilham Rd
- 4887 Hilham Rd
- 3006 Deerhaven Dr N
- 2908 Deerhaven Dr S
- 4201 Mirandy Rd
- 6538 6538 Hilham Rd
- 6538 Hilham Rd
- 000 Mirandy Rd
- 1917 Bear Creek Point
- 1921 Bear Creek Point
- 1909 Bear Creek Point
- 1913 Bear Creek Point
- 95 & 96 Bear Creek Point
- 1949 Bear Creek Point
- 1953 Bear Creek Point
- 1961 Bear Creek Point
- 1969 Bear Creek Point
- 1973 Bear Creek Point
- 1976 Bear Creek Point
- 2030 Bear Creek Point
- 2027 Bear Creek Point
- 2038 Bear Creek Point
- 2042 Bear Creek Point
- 2047 Bear Creek Point
- 1977 Bear Creek Point
- 1970 Bear Creek Point
- 1981 Bear Creek
- 1965 Bear Creek Point