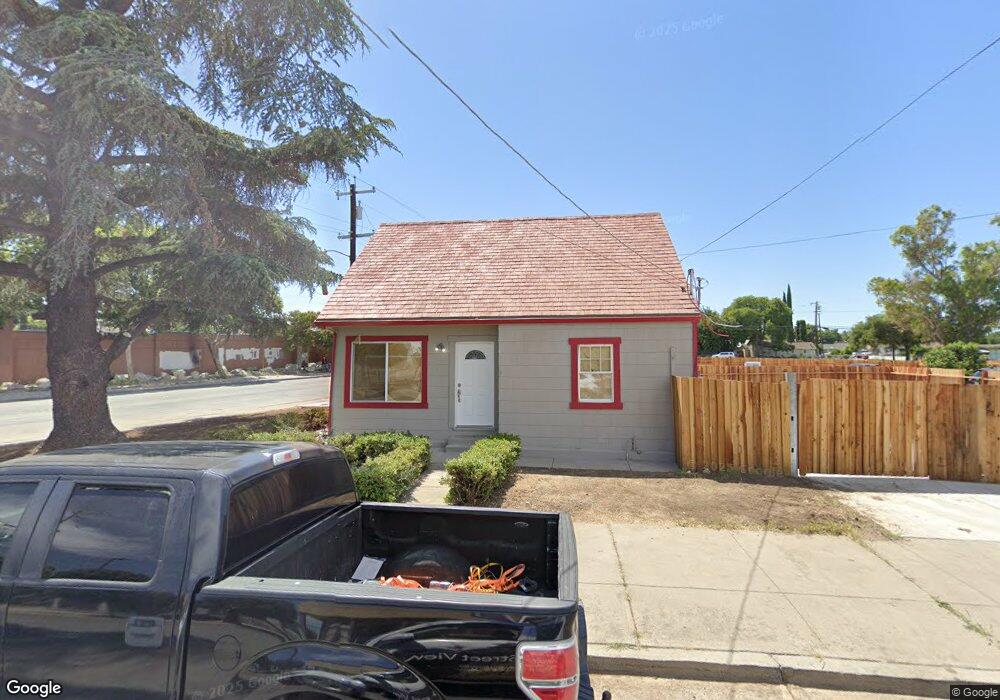
2014 C St Antioch, CA 94509
North Antioch NeighborhoodEstimated Value: $377,720 - $669,000
4
Beds
2
Baths
998
Sq Ft
$506/Sq Ft
Est. Value
About This Home
This home is located at 2014 C St, Antioch, CA 94509 and is currently estimated at $504,680, approximately $505 per square foot. 2014 C St is a home located in Contra Costa County with nearby schools including Fremont Elementary School, Antioch Middle School, and Antioch High School.
Ownership History
Date
Name
Owned For
Owner Type
Purchase Details
Closed on
Jul 24, 2020
Sold by
Fereira Carolyn B
Bought by
Gardner Valerie Boss and Gardner John David
Current Estimated Value
Purchase Details
Closed on
May 17, 2001
Sold by
Shively Mary Lou
Bought by
Shively Mary Lou
Purchase Details
Closed on
Feb 2, 2001
Sold by
Shively Mary Lou
Bought by
Shively Mary Lou
Purchase Details
Closed on
Apr 16, 1999
Sold by
Coller Anna Belle Tre
Bought by
Coller Anna B
Purchase Details
Closed on
Feb 15, 1995
Sold by
Coller Anna Belle
Bought by
Coller Anna Belle
Purchase Details
Closed on
Dec 29, 1993
Sold by
Abel Anna and Coller Anna Belle
Bought by
Coller Anna Belle
Create a Home Valuation Report for This Property
The Home Valuation Report is an in-depth analysis detailing your home's value as well as a comparison with similar homes in the area
Home Values in the Area
Average Home Value in this Area
Purchase History
| Date | Buyer | Sale Price | Title Company |
|---|---|---|---|
| Gardner Valerie Boss | $675,000 | Fidelity National Title Co | |
| Shively Mary Lou | -- | -- | |
| Shively Mary Lou | -- | -- | |
| Coller Anna B | -- | -- | |
| Coller Anna Belle | -- | -- | |
| Coller Anna Belle | -- | -- |
Source: Public Records
Tax History
| Year | Tax Paid | Tax Assessment Tax Assessment Total Assessment is a certain percentage of the fair market value that is determined by local assessors to be the total taxable value of land and additions on the property. | Land | Improvement |
|---|---|---|---|---|
| 2025 | $1,696 | $100,000 | $95,000 | $5,000 |
| 2024 | $1,731 | $111,426 | $106,120 | $5,306 |
| 2023 | $1,731 | $109,242 | $104,040 | $5,202 |
| 2022 | $1,710 | $107,100 | $102,000 | $5,100 |
| 2021 | $1,644 | $105,000 | $100,000 | $5,000 |
| 2019 | $964 | $45,426 | $14,213 | $31,213 |
| 2018 | $930 | $44,536 | $13,935 | $30,601 |
| 2017 | $898 | $43,663 | $13,662 | $30,001 |
| 2016 | $857 | $42,808 | $13,395 | $29,413 |
| 2015 | $835 | $42,166 | $13,194 | $28,972 |
| 2014 | $804 | $41,341 | $12,936 | $28,405 |
Source: Public Records
Map
Nearby Homes
Your Personal Tour Guide
Ask me questions while you tour the home.