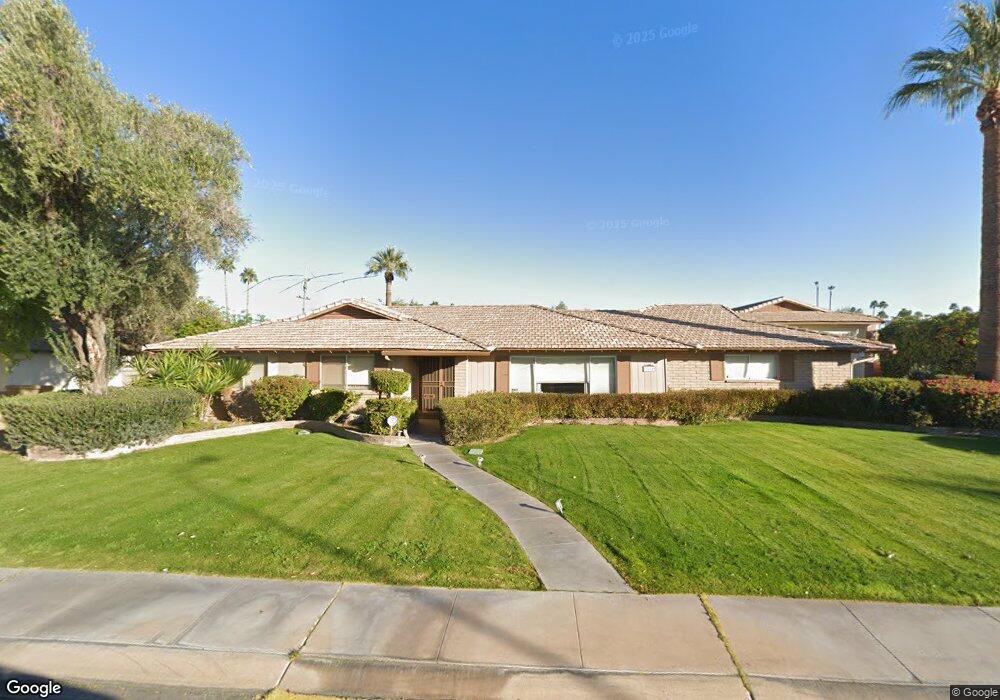
2014 E Pebble Beach Dr Tempe, AZ 85282
Alameda NeighborhoodEstimated Value: $629,441 - $703,000
Studio
3
Baths
2,539
Sq Ft
$265/Sq Ft
Est. Value
About This Home
This home is located at 2014 E Pebble Beach Dr, Tempe, AZ 85282 and is currently estimated at $673,860, approximately $265 per square foot. 2014 E Pebble Beach Dr is a home located in Maricopa County with nearby schools including Curry Elementary School, Connolly Middle School, and McClintock High School.
Ownership History
Date
Name
Owned For
Owner Type
Purchase Details
Closed on
Sep 23, 2025
Sold by
Toliver Vickie L
Bought by
Vickie L Toliver Trust and Toliver
Current Estimated Value
Purchase Details
Closed on
Aug 29, 2024
Sold by
Toliver Revocable Trust and Toliver Vickie L
Bought by
Toliver Vickie L
Purchase Details
Closed on
Sep 23, 2016
Sold by
M & F Property Holdings Llc
Bought by
Toliver Marquis L and Toliver Freda S
Purchase Details
Closed on
Dec 12, 2005
Sold by
Toliver M L and Toliver Freda S
Bought by
M & F Property Holdings Llc
Purchase Details
Closed on
Oct 31, 2005
Sold by
M & F Property Holdings Llc
Bought by
Toliver M L and Toliver Freda S
Create a Home Valuation Report for This Property
The Home Valuation Report is an in-depth analysis detailing your home's value as well as a comparison with similar homes in the area
Home Values in the Area
Average Home Value in this Area
Purchase History
| Date | Buyer | Sale Price | Title Company |
|---|---|---|---|
| Vickie L Toliver Trust | -- | None Listed On Document | |
| Toliver Vickie L | -- | None Listed On Document | |
| Toliver Marquis L | -- | None Available | |
| M & F Property Holdings Llc | -- | None Available | |
| Toliver M L | -- | -- |
Source: Public Records
Tax History
| Year | Tax Paid | Tax Assessment Tax Assessment Total Assessment is a certain percentage of the fair market value that is determined by local assessors to be the total taxable value of land and additions on the property. | Land | Improvement |
|---|---|---|---|---|
| 2025 | $3,923 | $37,628 | -- | -- |
| 2024 | $3,599 | $35,836 | -- | -- |
| 2023 | $3,599 | $53,500 | $10,700 | $42,800 |
| 2022 | $3,437 | $41,280 | $8,250 | $33,030 |
| 2021 | $3,505 | $38,310 | $7,660 | $30,650 |
| 2020 | $3,389 | $36,410 | $7,280 | $29,130 |
| 2019 | $3,324 | $35,010 | $7,000 | $28,010 |
| 2018 | $3,234 | $32,970 | $6,590 | $26,380 |
| 2017 | $3,134 | $31,430 | $6,280 | $25,150 |
| 2016 | $3,118 | $33,550 | $6,710 | $26,840 |
Source: Public Records
Map
Nearby Homes
- 1959 E Laguna Dr
- 1941 E Pebble Beach Dr
- 2063 E La Jolla Dr
- 2015 E Southern Ave Unit 14
- 2015 E Southern Ave Unit 22
- 2015 E Southern Ave Unit 23
- 3147 S Fairfield Dr
- 1938 E Greenway Dr
- 1985 E Carson Dr
- 1874 E Geneva Dr
- 2115 E Greenway Dr
- 4705 S Country Club Way
- 1725 E La Jolla Dr
- 3706 S Cottonwood Dr Unit 2
- 1717 E Pebble Beach Dr Unit 6
- 2065 E Cairo Dr
- 2333 E Southern Ave Unit 2067
- 2333 E Southern Ave Unit 1075
- 2333 E Southern Ave Unit 2080
- 1939 E Alameda Dr
- 2022 E Pebble Beach Dr
- 2006 E Pebble Beach Dr
- 2017 E Laguna Dr
- 2025 E Laguna Dr
- 2015 E Pebble Beach Dr
- 2009 E Laguna Dr
- 2007 E Pebble Beach Dr
- 2023 E Pebble Beach Dr
- 2030 E Pebble Beach Dr
- 2033 E Laguna Dr
- 1996 E Pebble Beach Dr
- 2031 E Pebble Beach Dr
- 1995 E Laguna Dr
- 2016 E Laguna Dr
- 2012 E La Jolla Dr
- 1997 E Pebble Beach Dr
- 2024 E Laguna Dr
- 2008 E Laguna Dr
- 2004 E La Jolla Dr
- 2018 E La Jolla Dr
Your Personal Tour Guide
Ask me questions while you tour the home.