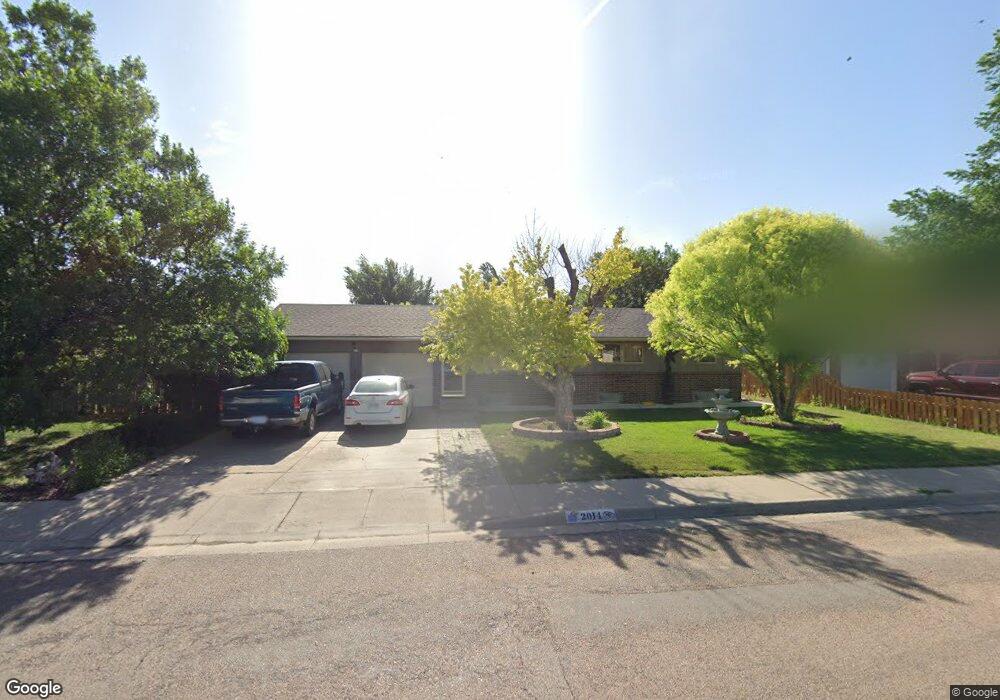
2014 N Cherokee Rd Garden City, KS 67846
Estimated Value: $198,000 - $291,000
5
Beds
3
Baths
1,161
Sq Ft
$224/Sq Ft
Est. Value
About This Home
This home is located at 2014 N Cherokee Rd, Garden City, KS 67846 and is currently estimated at $259,969, approximately $223 per square foot. 2014 N Cherokee Rd is a home located in Finney County with nearby schools including Florence Wilson Elementary School, Kenneth Henderson Middle School, and Charles O. Stones Intermediate Center.
Ownership History
Date
Name
Owned For
Owner Type
Purchase Details
Closed on
Nov 26, 2014
Sold by
Lira Doralia and Lira Obed
Bought by
Lira Doralia and Lira Obed
Current Estimated Value
Purchase Details
Closed on
May 18, 2010
Sold by
Koons Dryl T and Koons Paula J
Bought by
Lira Doralia and Hernandez Carolina
Home Financials for this Owner
Home Financials are based on the most recent Mortgage that was taken out on this home.
Original Mortgage
$125,767
Outstanding Balance
$85,118
Interest Rate
5.25%
Mortgage Type
FHA
Estimated Equity
$174,851
Purchase Details
Closed on
Mar 21, 2008
Sold by
Lira Doralia and Lira Obed
Bought by
Lira Doralia and Hernandez Carolina
Home Financials for this Owner
Home Financials are based on the most recent Mortgage that was taken out on this home.
Original Mortgage
$66,800
Interest Rate
3.59%
Mortgage Type
New Conventional
Create a Home Valuation Report for This Property
The Home Valuation Report is an in-depth analysis detailing your home's value as well as a comparison with similar homes in the area
Home Values in the Area
Average Home Value in this Area
Purchase History
| Date | Buyer | Sale Price | Title Company |
|---|---|---|---|
| Lira Doralia | -- | First American Title | |
| Lira Doralia | -- | None Available | |
| Lira Doralia | -- | None Available |
Source: Public Records
Mortgage History
| Date | Status | Borrower | Loan Amount |
|---|---|---|---|
| Open | Lira Doralia | $125,767 | |
| Previous Owner | Lira Doralia | $66,800 |
Source: Public Records
Tax History Compared to Growth
Tax History
| Year | Tax Paid | Tax Assessment Tax Assessment Total Assessment is a certain percentage of the fair market value that is determined by local assessors to be the total taxable value of land and additions on the property. | Land | Improvement |
|---|---|---|---|---|
| 2024 | $4,907 | $29,897 | $1,967 | $27,930 |
| 2023 | $4,907 | $28,963 | $1,967 | $26,996 |
| 2022 | $4,333 | $26,537 | $1,967 | $24,570 |
| 2021 | $3,729 | $22,571 | $1,339 | $21,232 |
| 2020 | $3,456 | $21,305 | $1,339 | $19,966 |
| 2019 | $3,415 | $21,359 | $1,339 | $20,020 |
| 2018 | $3,192 | $20,061 | $1,112 | $18,949 |
| 2017 | $3,012 | $0 | $0 | $0 |
| 2016 | $2,907 | $0 | $0 | $0 |
| 2015 | $2,660 | $0 | $0 | $0 |
| 2012 | -- | $0 | $0 | $0 |
Source: Public Records
Map
Nearby Homes
- 2302 E Fair St
- 1605 Remington Place
- 1601 N Remington Place
- 1810 N Koster St
- 1710 E Crestway Dr
- 2402 N Koster St
- 1622 E Crestway Dr
- 1517 E Johnson St
- 2001 Bison Dr
- 1505 E Melanie Ln
- 1705 N Anderson St
- 2808 N Broadmoor Place
- 2504 N Carriage Ln
- 1305 E Mary St
- 2505 N Carriage Ln
- 2106 N Belmont Place Unit 4
- 2143 Idlewild Way
- 2142 Idlewild Way
- 2150 Idlewild Way
- 2617 N Coachman Ln
- 2012 N Cherokee Rd
- 2011 N Apache Dr
- 2010 N Cherokee Rd
- 2308 E Fair St
- 2009 N Apache Dr
- 2013 N Cherokee Rd
- 2011 N Cherokee Rd
- 2208 E Fair St
- 2007 N Apache Dr
- 2008 N Cherokee Rd
- 2303 E Fair St
- 2009 N Cherokee Rd
- 2307 E Fair St
- 2005 N Apache Dr
- 2007 N Cherokee Rd
- 2006 N Cherokee Rd
- 2207 E Fair St
- 2104 N Cherokee Rd
- 2012 N Apache Dr
- 2404 E Fair St