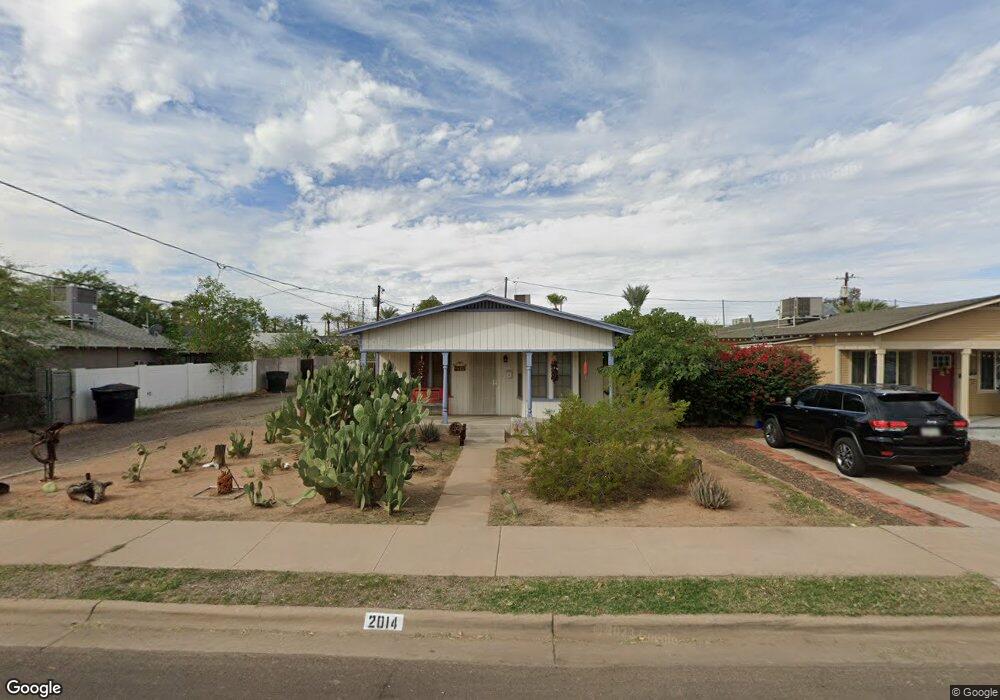
2014 N Richland St Phoenix, AZ 85006
Coronado NeighborhoodEstimated Value: $435,088 - $529,000
--
Bed
1
Bath
1,020
Sq Ft
$484/Sq Ft
Est. Value
About This Home
This home is located at 2014 N Richland St, Phoenix, AZ 85006 and is currently estimated at $493,522, approximately $483 per square foot. 2014 N Richland St is a home located in Maricopa County with nearby schools including Emerson Elementary School, North High School, and Phoenix Coding Academy.
Ownership History
Date
Name
Owned For
Owner Type
Purchase Details
Closed on
Aug 31, 2005
Sold by
Clark Bobbie E and Bucci Mary Ane
Bought by
Wise John R
Current Estimated Value
Home Financials for this Owner
Home Financials are based on the most recent Mortgage that was taken out on this home.
Original Mortgage
$203,600
Outstanding Balance
$108,035
Interest Rate
5.72%
Mortgage Type
New Conventional
Estimated Equity
$385,487
Purchase Details
Closed on
Oct 26, 2001
Sold by
Vanderpool John Edward
Bought by
Clark Bobbie E and Bucci Mary Anne
Home Financials for this Owner
Home Financials are based on the most recent Mortgage that was taken out on this home.
Original Mortgage
$120,920
Interest Rate
6.84%
Mortgage Type
New Conventional
Purchase Details
Closed on
May 26, 1998
Sold by
Revest Inc
Bought by
Vanderpool John Edward
Home Financials for this Owner
Home Financials are based on the most recent Mortgage that was taken out on this home.
Original Mortgage
$77,914
Interest Rate
7.13%
Mortgage Type
FHA
Purchase Details
Closed on
Aug 26, 1997
Sold by
Miles Kathleen C and Almaguer Marie
Bought by
Revest Inc
Create a Home Valuation Report for This Property
The Home Valuation Report is an in-depth analysis detailing your home's value as well as a comparison with similar homes in the area
Home Values in the Area
Average Home Value in this Area
Purchase History
| Date | Buyer | Sale Price | Title Company |
|---|---|---|---|
| Wise John R | $254,500 | Title Guaranty Agency Of Az | |
| Clark Bobbie E | $122,000 | First American Title | |
| Vanderpool John Edward | $78,600 | Nations Title Insurance | |
| Revest Inc | $20,300 | Chicago Title Insurance Co |
Source: Public Records
Mortgage History
| Date | Status | Borrower | Loan Amount |
|---|---|---|---|
| Open | Wise John R | $203,600 | |
| Previous Owner | Clark Bobbie E | $120,920 | |
| Previous Owner | Vanderpool John Edward | $77,914 |
Source: Public Records
Tax History Compared to Growth
Tax History
| Year | Tax Paid | Tax Assessment Tax Assessment Total Assessment is a certain percentage of the fair market value that is determined by local assessors to be the total taxable value of land and additions on the property. | Land | Improvement |
|---|---|---|---|---|
| 2025 | $1,682 | $13,301 | -- | -- |
| 2024 | $1,562 | $12,668 | -- | -- |
| 2023 | $1,562 | $34,480 | $6,890 | $27,590 |
| 2022 | $1,502 | $28,030 | $5,600 | $22,430 |
| 2021 | $1,503 | $24,930 | $4,980 | $19,950 |
| 2020 | $1,525 | $23,960 | $4,790 | $19,170 |
| 2019 | $1,525 | $21,670 | $4,330 | $17,340 |
| 2018 | $1,498 | $17,520 | $3,500 | $14,020 |
| 2017 | $1,445 | $16,460 | $3,290 | $13,170 |
| 2016 | $1,404 | $13,970 | $2,790 | $11,180 |
| 2015 | $1,279 | $12,810 | $2,560 | $10,250 |
Source: Public Records
Map
Nearby Homes
- 2221 N Richland St
- 2211 N 7th St
- 2241 N Richland St
- 1650 N 10th St
- 2046 N 11th St
- 2206 N 11th St
- 2034 N Mitchell St
- 341 E Monte Vista Rd
- 385 E Coronado Rd Unit 6
- 2314 N 11th St
- 2502 N 10th St
- 2336 N 11th St
- 914 E Sheridan St
- 319 E Palm Ln
- 319 E Palm Ln Unit 36
- 1116 E Almeria Rd
- 325 E Coronado Rd Unit 10
- 325 E Coronado Rd Unit 13
- 319 E Coronado Rd Unit 1
- 2501 N 11th St
- 2018 N Richland St
- 2012 N Richland St
- 2022 N Richland St
- 814 E Palm Ln
- 810 E Palm Ln
- 2013 N 8th St
- 2002 N Richland St
- 2026 N Richland St
- 806 E Palm Ln
- 2021 N 8th St
- 2015 N 8th St
- 2013 N Richland St
- 826 E Palm Ln
- 2017 N Richland St
- 2030 N Richland St
- 2025 N 8th St
- 2021 N Richland St
- 802 E Palm Ln
- 830 E Palm Ln Unit 1/2
- 830 E Palm Ln