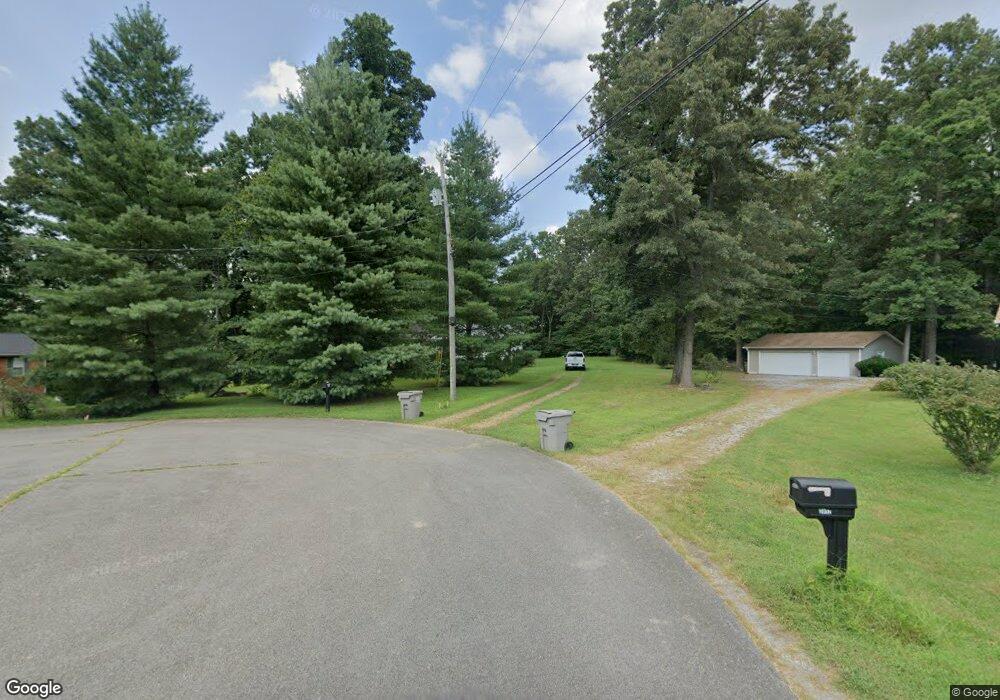
2014 Orion Jones Rd Chapmansboro, TN 37035
Estimated Value: $333,000 - $378,000
--
Bed
2
Baths
1,196
Sq Ft
$299/Sq Ft
Est. Value
About This Home
This home is located at 2014 Orion Jones Rd, Chapmansboro, TN 37035 and is currently estimated at $358,139, approximately $299 per square foot. 2014 Orion Jones Rd is a home located in Cheatham County with nearby schools including Pleasant View Elementary School, Sycamore Middle School, and Sycamore High School.
Ownership History
Date
Name
Owned For
Owner Type
Purchase Details
Closed on
Oct 17, 2008
Sold by
Barnes Brandon
Bought by
Salbato Nathan A
Current Estimated Value
Home Financials for this Owner
Home Financials are based on the most recent Mortgage that was taken out on this home.
Original Mortgage
$146,107
Outstanding Balance
$94,075
Interest Rate
5.78%
Estimated Equity
$264,064
Purchase Details
Closed on
Mar 5, 2003
Sold by
Chase Manhattan Mtg
Bought by
Barnes Brandon and Barnes Charlotte
Home Financials for this Owner
Home Financials are based on the most recent Mortgage that was taken out on this home.
Original Mortgage
$103,900
Interest Rate
5.88%
Purchase Details
Closed on
Apr 11, 2002
Sold by
Weatherby Brad and Weatherby Laken
Bought by
Chase Manhattan Mtg
Purchase Details
Closed on
Apr 12, 2000
Sold by
Biggs Ronnie L
Bought by
Weatherby Brad
Create a Home Valuation Report for This Property
The Home Valuation Report is an in-depth analysis detailing your home's value as well as a comparison with similar homes in the area
Home Values in the Area
Average Home Value in this Area
Purchase History
| Date | Buyer | Sale Price | Title Company |
|---|---|---|---|
| Salbato Nathan A | $148,400 | -- | |
| Barnes Brandon | $103,900 | -- | |
| Chase Manhattan Mtg | $86,700 | -- | |
| Weatherby Brad | $102,500 | -- |
Source: Public Records
Mortgage History
| Date | Status | Borrower | Loan Amount |
|---|---|---|---|
| Open | Weatherby Brad | $146,107 | |
| Previous Owner | Weatherby Brad | $103,900 |
Source: Public Records
Tax History Compared to Growth
Tax History
| Year | Tax Paid | Tax Assessment Tax Assessment Total Assessment is a certain percentage of the fair market value that is determined by local assessors to be the total taxable value of land and additions on the property. | Land | Improvement |
|---|---|---|---|---|
| 2024 | $1,667 | $96,300 | $47,250 | $49,050 |
| 2023 | $1,192 | $41,850 | $10,725 | $31,125 |
| 2022 | $1,126 | $41,850 | $10,725 | $31,125 |
| 2021 | $1,126 | $41,850 | $10,725 | $31,125 |
| 2020 | $1,126 | $41,850 | $10,725 | $31,125 |
| 2019 | $1,126 | $41,850 | $10,725 | $31,125 |
| 2018 | $991 | $31,575 | $7,125 | $24,450 |
| 2017 | $938 | $31,575 | $7,125 | $24,450 |
| 2016 | $892 | $31,575 | $7,125 | $24,450 |
| 2015 | $858 | $28,425 | $7,125 | $21,300 |
| 2014 | $858 | $28,425 | $7,125 | $21,300 |
Source: Public Records
Map
Nearby Homes
- 55 Bear Branch Place
- 1810 Old Clarksville Pike
- 1726 Old Clarksville Pike
- 1 Old Clarksville Pike
- 1140 Bateman Ct
- 0 Cedar Hill Unit RTC2944570
- 1985 Country View
- 0 Old Clarksville Pike Unit RTC2787076
- 1018 Interstate Park Cir
- 5181 Thomasville Rd
- 1136 Dimple Rd
- 315 Peggy Dr
- 0 Kathleen Dr
- 2220 Pleasant View Rd
- 1059 Kaitlynn Cir
- 5075 Old Clarksville Pike
- 0 Ross Rd
- 1 Maxey Rd
- 0 Poplar Ridge Ln
- 1998 Blue Bird Dr
- 2013 Orion Jones Rd
- 2012 Orion Jones Rd
- 2011 Orion Jones Rd
- 2010 Orion Jones Rd
- 1039 Golden Pond Rd
- 168 Camaro Dr
- 2008 Orion Jones Rd
- 1033 Golden Pond Rd
- 2007 Orion Jones Rd
- 1029 Golden Pond Rd
- 2004 Orion Jones Rd
- 1030 Golden Pond Rd
- 1027 Golden Pond Rd
- 2011 Ruby Travis Dr
- 2000 Orion Jones Rd
- 180 Camaro Dr
- 2009 Ruby Travis Dr
- 1056 Ervin Pace Rd
- 1050 Ervin Pace Rd
- 2010 Ruby Travis Dr